Written by Corbett Rowell | August 8, 2022
5G mobile network testing using a passive network scanner (Part 2)
Technical Background and Measurement Setup

Written by Corbett Rowell | August 8, 2022
Technical Background and Measurement Setup

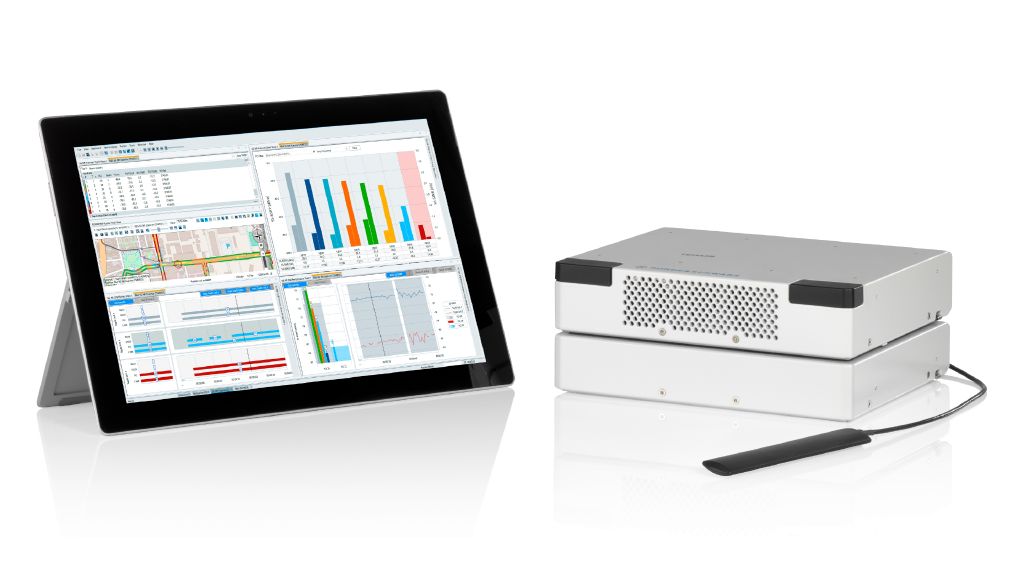
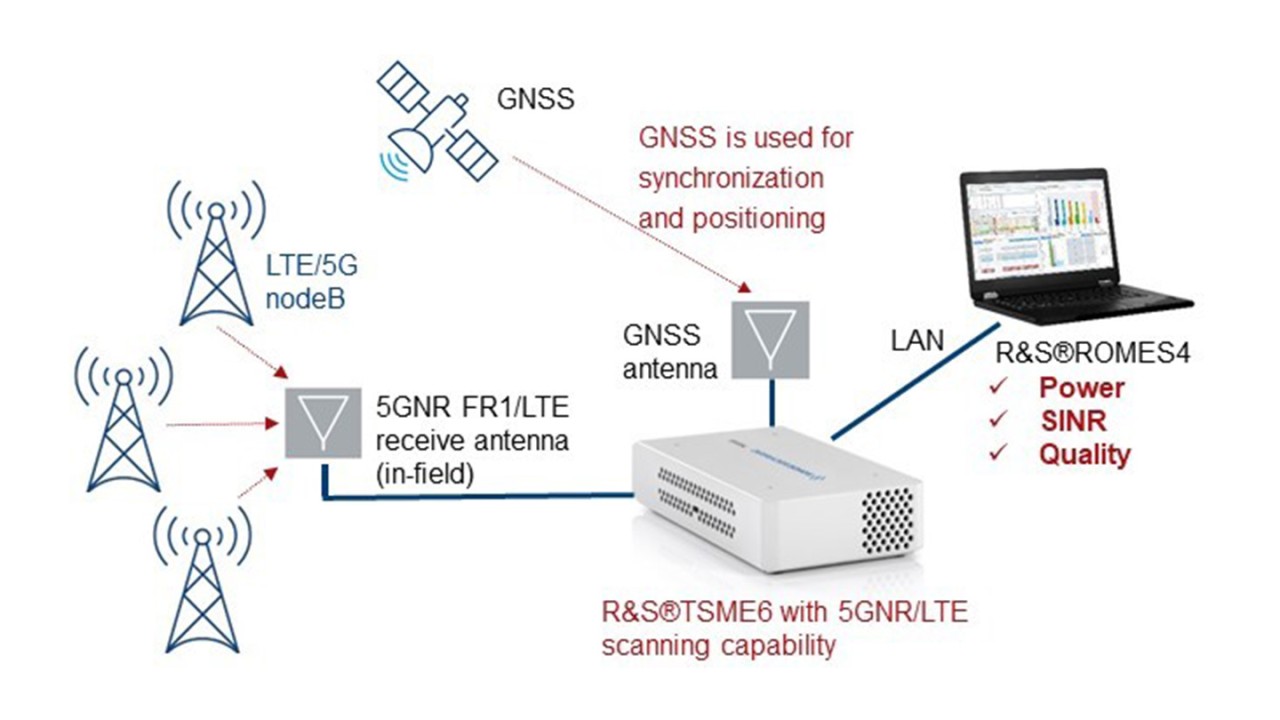
Figure 1 shows the proposed measurement setup with a passive receiver (scanner) with no transmission capability for security reasons. The mobile network scanner (R&S®TSME6) measures the wireless signal from 5G FR1 and LTE cells with an external antenna, converts this signal to a digital baseband signal (IQ symbols), and sends it to a connected laptop for demodulation, analysis and presentation.
An internal global navigation satellite system (GNSS) receiver for measurement of its geographical position as well as receiving date and time information is part of the scanner. The scanner is able to measure a baseband signal with bandwidth of 20MHz within the frequency range between 350MHz and 6GHz whereas the frequency range can be controlled by the measurement software on the laptop.
The measurement software can be based on R&S ViCom++, an open application programming interface (Web-API) allowing custom made scanner applications. Alternatively, the ready-to-use software R&S®ROMES4 can be used. For some measurements we use the scanner R&S®TSMA6 which integrates the TSME6 and the processor for the measurement software into one box.

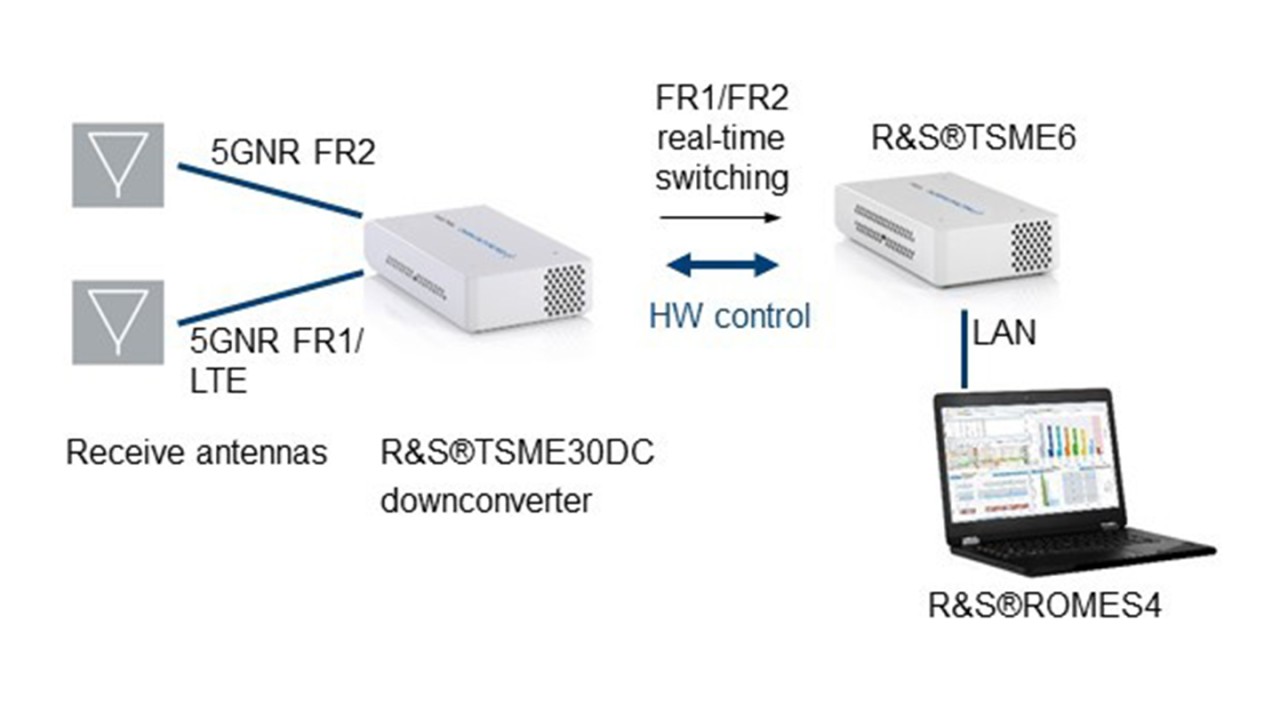
The carrier aggregation framework in 5G NR allows to complement operation in FR2 with a FR1-carrier to ensure good coverage [1]. Therefore, simultaneous SSB measurements in 5G FR1 and FR2 are required. Figure 2 shows the measurement setup for FR2 which contains an additional downconverter. The downconverter converts the millimeter wave signal to an intermediate frequency range below 6 GHz, allowing a single scanner to support simultaneous measurements in FR1 and FR2 with dedicated antennas.
One single scanner with one downconverter supports SSB measurements in FR2. It is possible to connect several scanners with one downconverter, extending the baseband bandwidth to 100MHz (not necessary for current applications).

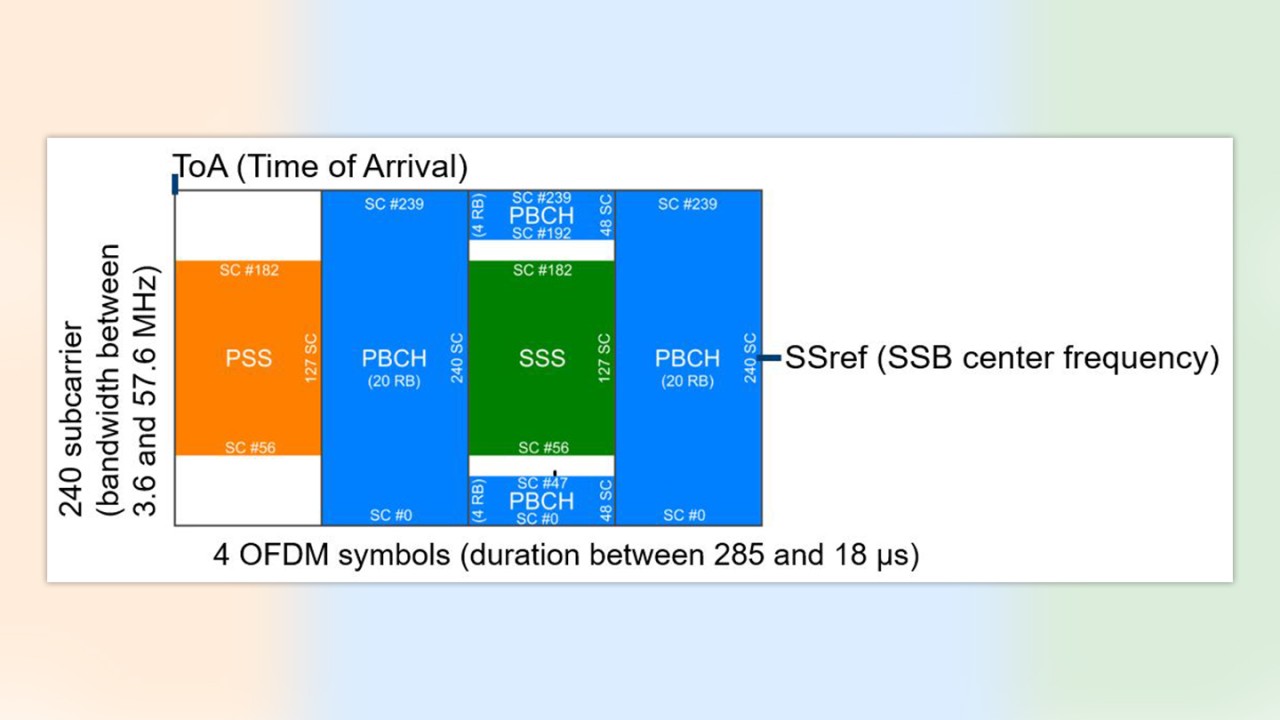
5G NR technology uses orthogonal frequency-division multiplexing (OFDM) [2] for the downlink transmission. A band dependent table in [3], [4] defines whether time division duplex (TDD) or frequency division duplex (FDD) is used to divide downlink and uplink. A 5G NR cell broadcasts SSBs (synchronization signal/physical broadcast channel blocks) in order to enable cell search and initial access.
Figure 3 shows a 5G NR SSB where one SSB is mapped to 4 OFDM symbols and 240 subcarriers (SC). The SSB consists of one PBCH block, a primary, and a secondary synchronization signal (PSS and SSS). There are different SC spacings (SCS) defined: from 15kHz for Case A in FR1 to 240kHz for Case E in FR2 [5]. Therefore, the bandwidth of one SSB is between 3.6MHz and 57.6MHz.
Correspondingly, the SSB duration is between 285µs and 18µs, allowing the flexibility to use 5G NR in different frequency ranges and use cases [1]. One cell transmits up to 64 SSBs within a 5ms window (up to 4 or 8 SSBs for SCS of 15/30kHz). Each of these SSBs has a specific index which is encoded beside the cell-specific Physical Cell Identity (PCI) into the SSB-signal. The start time of an SSB within the 5ms window depends on the index as defined in [5].
The cells broadcast these 5ms windows periodically (default period is 20ms). As an example, the scanner measures the reception quality and arrival time of the SSBs with a typical result as follows:
SSref=3531MHz,ToA=795µs,PCI=393,SSB-index=3,SS-RSRP=-120dBm,SS-SINR=3dB

Typically, a cell uses beamforming to transmit the SSBs into different directions (beam sweeping) and consequently, the SSBs are also referred to as beams. These beams can be considered as micro-sectors which further split the macro-sector of the complete cell (typically 120°) into smaller angular portions [6].
Figure 5 illustrates the main transmission direction of 6 SSBs of one cell on a map. The use of beamforming for synchronization signals and PBCH provides better overall coverage. Note that the direction of beams can be two-dimensional in the sense that each SSB transmits into a specific azimuth- and tilt-angle.
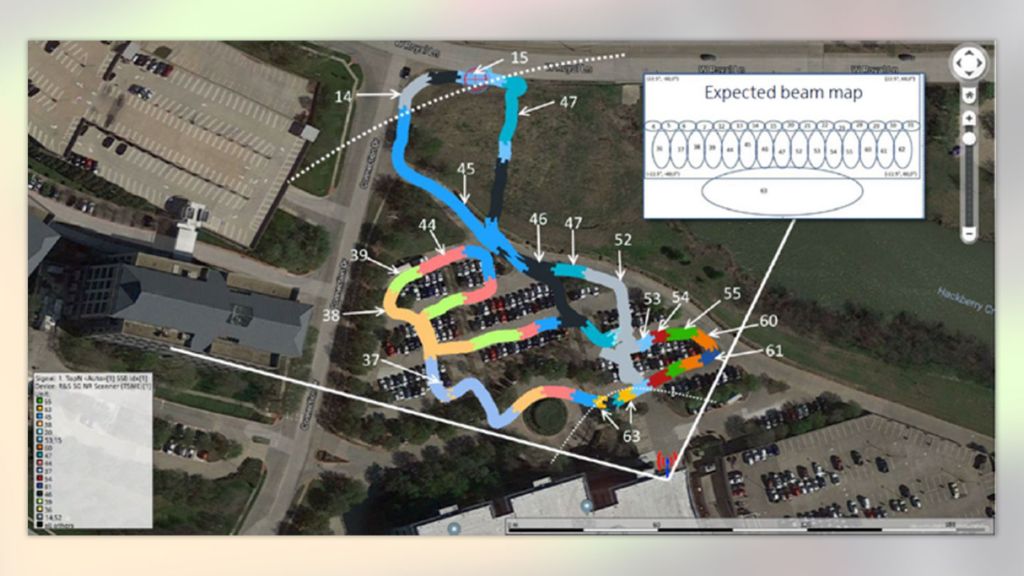
Figure 4 illustrates a walk-test measurement for the SSB index distribution in FR2 together with the expected beam number mapping of a two-dimensional beam number mapping (SSB-indices 4 to 35 with low tilt, 36 to 62 with medium tilt and 63 with high tilt).
![Figure 5: Transmission direction of 6 SSBs of one cell estimated from a comparison of the measured received power for all SSBs during a drivetest (enveloping color of drive-test-route corresponds to SSB with strongest receive power) [7] Figure 5: Transmission direction of 6 SSBs of one cell estimated from a comparison of the measured received power for all SSBs during a drivetest (enveloping color of drive-test-route corresponds to SSB with strongest receive power) [7]](https://cdn.rohde-schwarz.com/pws/inred/image/placeholder_1/placeholder-1024x576_w1300_hX.png)
![Figure 5: Transmission direction of 6 SSBs of one cell estimated from a comparison of the measured received power for all SSBs during a drivetest (enveloping color of drive-test-route corresponds to SSB with strongest receive power) [7] Figure 5: Transmission direction of 6 SSBs of one cell estimated from a comparison of the measured received power for all SSBs during a drivetest (enveloping color of drive-test-route corresponds to SSB with strongest receive power) [7]](https://cdn.rohde-schwarz.com/pws/solution/mobile_network_testing/mnt_blog/5g_mobile_network_testing_using_a_passive_network_scanner__part_2_/05_Figure5_w1280_hX.jpg)
Figure 5 shows the route of a drive-test which is often used for mobile network testing. The aim of this drive-test is to measure the reception quality of the base station cells and their SSBs in order to determine network quality and coverage.
The drive-tests are also used to find interference from either other cells or unlicensed deployments. Variations of the conventional drive-tests are walk-tests (Figure 4), bike-tests, and drone-tests, requiring a small passive receiver with low power consumption due to limited battery capacity.
This set of blog posts is describing the mobile network testing approach for 5G NR with a passive scanner which measures synchronization signal (SS)/ physical broadcast channel (PBCH) blocks (or SSBs) broadcasted from 5G NR base stations.
In the next blog post, we will start addressing individual challenges and their solutions with measurements results of real networks. Challenges include: finding carrier frequencies with SSBs, network synchronization, code selective electromagnetic field strength measurements, base station position estimation, and the effect of measurement antenna patterns on mobile network testing.
If you have suggestions on other challenges you would like for our team to solve, feel free to email your favorite R&S contact.
Learn more about 5G site acceptance scenarios, KPIs, test techniques, and field measurement results and watch the on-demand Webinar “5G Site Testing including latest real world challenges”.
[1] X. Lin et al., 5G New Radio: Unveiling the Essentials of the Next Generation Wireless Access Technology, IEEE Communications Standards Magazine, Sep 2019
[2] S. Ahmadi, 5G NR: Architecture, Technology, Implementation, and Operation of 3GPP New Radio Standards, Academic Press, 2019
[3] 3GPP technical specification TS 38.101-2, NR; User Equipment (UE) radio transmission and reception; Part 2: Range 2 Standalone, V16.8.0, June 2021
[4] 3GPP technical specification TS 38.101-1, NR; User Equipment (UE) radio transmission and reception; Part 1: Range 1 Standalone, V16.8.0, June 2021
[5] 3GPP technical specification TS 38.213, NR; Physical layer procedures for control, V16.6.0, June 2021
[6] A. Sibila, 5G NR network rollout is now - let’s test!, MWeek RFmicrowave, July 2019
[7] M. Mielke and M. Hylen, 5G NR Network Measurements using Network Scanners and Advanced Data Analytics, Version 3.0, Application Note, Rohde & Schwarz, April 2019
Read more about "5G mobile network testing using a passive scanner" part 1 - 4 of this series:
5G mobile network testing using a passive scanner (part 1)
5G mobile network testing using a passive scanner (part 3)
5G mobile network testing using a passive scanner (part 4)