Analyze EMI problems with the R&S®RTO / R&S®RTE

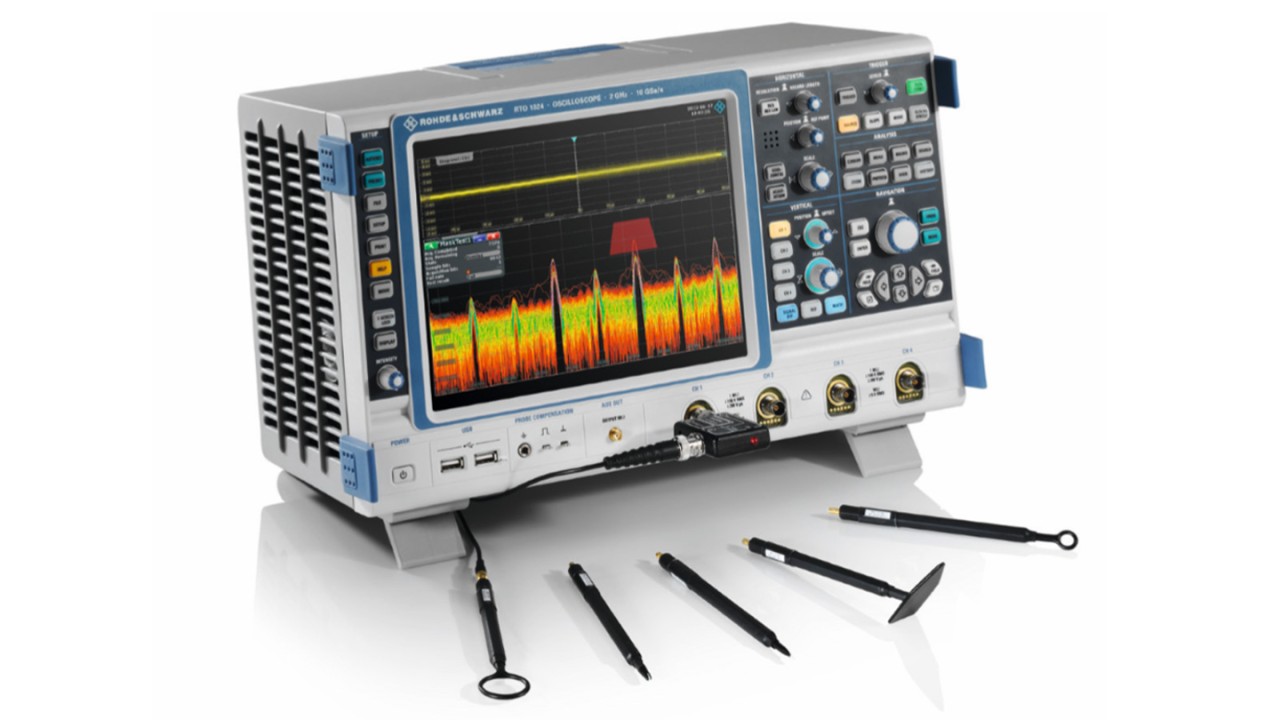
The R&S®RTO / R&S®RTE oscilloscope is a valuable tool for analyzing EMI problems in electronic designs. High input sensitivity, high dynamic range and a powerful FFT implementation are key features for capturing and analyzing unwanted emissions.

Analyze EMI problems with the RTO and RTE

Your Task

When debugging electromagnetic interference (EMI) problems, the electronic design engineer faces the challenging problem of identifying the sources of unwanted emissions and developing a solution for them. Often, the only information that comes back from the EMC test laboratory is a spectrum curve indicating the frequencies where emissions are critical or violating the limits. Repetitive testing at the EMC compliance laboratory to identify and resolve the problem is costly and often significantly delays the product launch.

Rohde & Schwarz solution

The R&S®RTO/RTE oscilloscope is a powerful instrument for debugging EMI problems on the design engineer’s desk. In combination with a near-field probe set it allows the designer to quickly locate and analyze EMI problems. High dynamic range and high input sensitivity of 1 mV/ div ensure that even weak emissions can be analyzed. The R&S®RTO/RTE fast Fourier transform (FFT) implementation provides a fast update rate and the FFT frame overlay processing and persistence display allow insights into the structure of unwanted emissions. This helps the designer to quickly detect the source of the emission.

Rohde & Schwarz offers the compact R&S®HZ-15 near-field probe set, which is particularly helpful for EMI debugging of embedded designs. The most compact probe in this set allows capturing of near-field emissions from single circuit lines. The R&S®HZ-15 covers the frequency range from 30 MHz to 3 GHz. It can be also used below 30 MHz, with reduced sensitivity. The optional R&S®HZ-16 preamplifier provides a gain of 20 dB in the frequency range from 100 kHz to 3 GHz, in case higher sensitivity is needed.

Easy navigation in frequency domain with a familiar spectrum analyzer interface.

Application

Easy setup

Only a few steps are needed to reach a good starting point for an EMI debugging session:

  • Press “Preset” to start with a well-defined setting
  • Connect a near-field probe to an input channel
  • Set the vertical scale of the channel anywhere from 1 mV/div to 5 mV/div for high sensitivity and set thecoupling to 50 Ω
  • Enable the FFT function with the FFT toolbar icon
  • Enable the color table for the FFT signal via display ▷ signal colors ▷ enable color table
  • Enlarge the horizontal scale to 40 μs/div for a long record length

High capture bandwidth and easy navigation in frequency domain

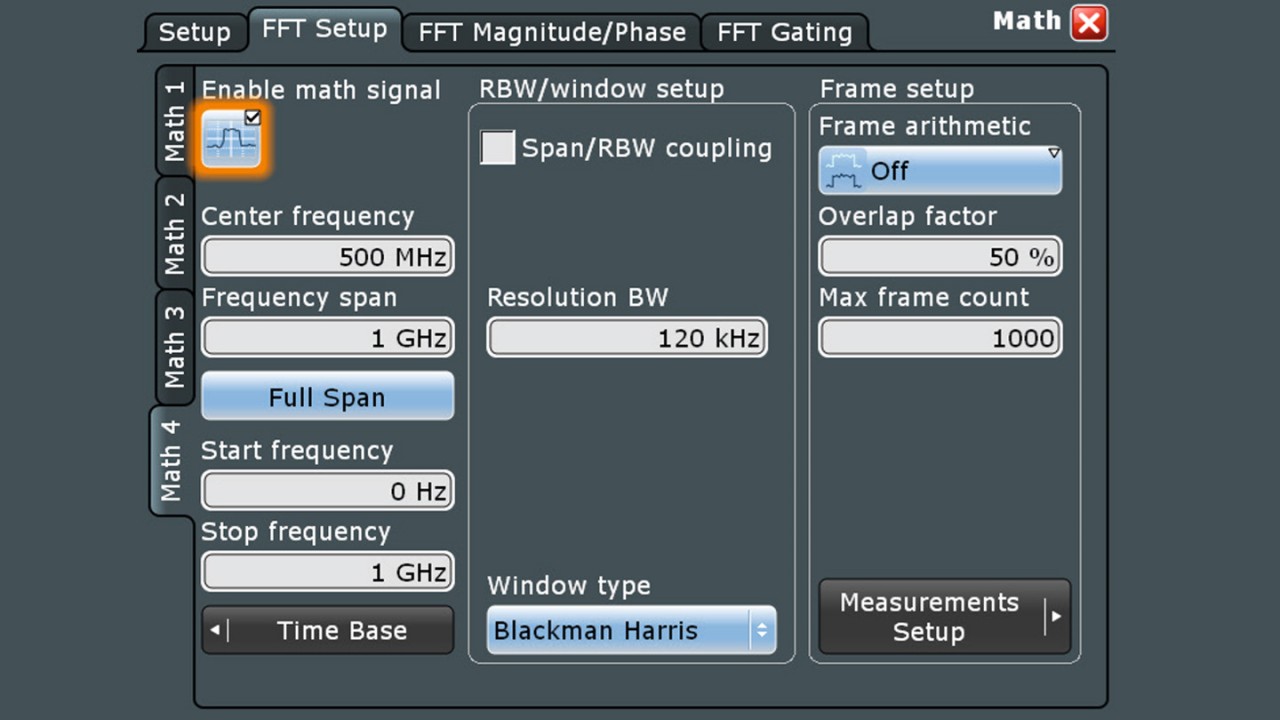
The R&S®RTO/RTE FFT has the familiar interface of a spectrum analyzer. The FFT setup dialog offers basic spectrum analyzer controls such as start and stop frequency and resolution bandwidth. In the FFT mode, the R&S®RTO/RTE automatically adjusts time domain settings accordingly. This makes navigation in the frequency domain an easy task.

The captured time domain signal is also available for analysis at the same time. The maximum FFT capture bandwidth corresponds to the R&S®RTO/RTE model’s bandwidth. For example, the R&S®RTO2064 allows a quick overview of all the test device’s emissions from 0 Hz to 6 GHz.

Capture sporadic events with the frequency mask function.
Open Lightbox

Overlap FFT implementation with color-coded display of spectral components

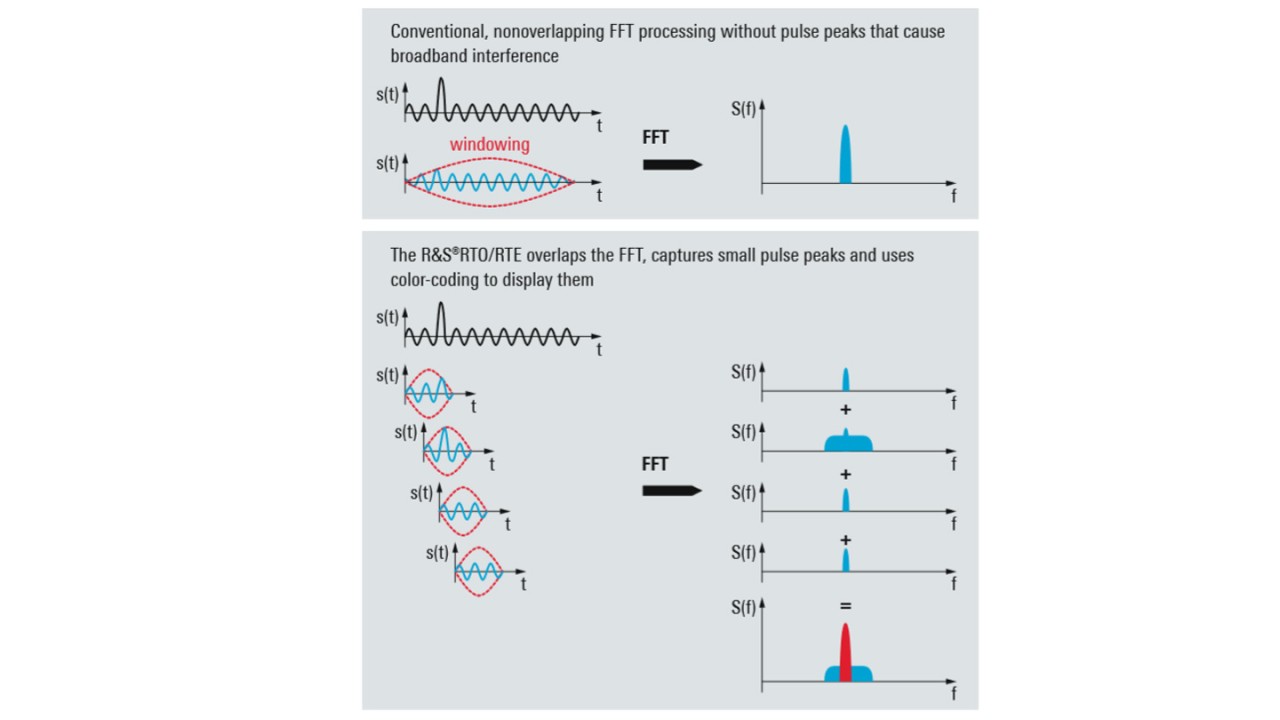
The overlap FFT implementation in the R&S®RTO/RTE first automatically splits the captured time domain signal into overlapping segments. In a second step, it calculates the FFT for each segment in order to display intermittent signals such as pulse type interferers. Color coding the resulting spectral lines according to their frequency of occurrence visualizes the intermittent signals.

Overlap FFT implementation

Gated FFT for correlated time-frequency analysis

With the gated FFT function, it is possible to restrict the spectrum analysis to a user-defined region of the captured time-domain signal. Excessive spectral emissions can be correlated to dedicated time periods in a signal. Typical applications include the correlation of unwanted emissions to fast switching edges in switched-mode power supplies or to data transfers on bus interfaces. Having identified the problem, the design engineer can easily check the effectiveness of different solutions such as blocking capacitors or reduced rise/fall times by observing the level change of the spectral emission.

Capturing sporadic events with frequency masks

Intermittent or sporadic emissions are the most difficult to debug. They are difficult to capture and not easy to analyze. The R&S®RTO/RTE mask tool allows these events to be captured. Once the mask is violated, the acquisition stops automatically and the user can adjust FFT settings such as resolution bandwidth or gate and use additional tools such as cursors for more detailed analysis.

Related solutions