Written by Jens Berger | November 24, 2016


The performance of video services has a considerable influence on customer satisfaction. For the mobile network operator, the decision to deliver a higher or lower resolution, and finally quality, can significantly impact his infrastructure due to the vast amount of data that might or might not be necessary to transmit.
The same applies to content providers delivering videos. To pack videos more efficiently, they frequently update their compression techniques and adapt their delivery strategies to cope with imperfect networks, potential outages, and bottlenecks.
Today, there is a general tendency towards higher resolutions. This is in line with the increasing transport capacity of networks, high-resolution screens of smartphones, and increasing user expectations.
What are the key characteristics that drive user satisfaction?
Various video applications and services are available on the market, the most popular being YouTube. To better understand what drives video quality, we have to analyze the different protocol behaviors and streaming/buffering methods of different video service types. To approximate the user’s perception and, at the same time, detect potential bottlenecks in a single test case, we also need to consider video reproduction.
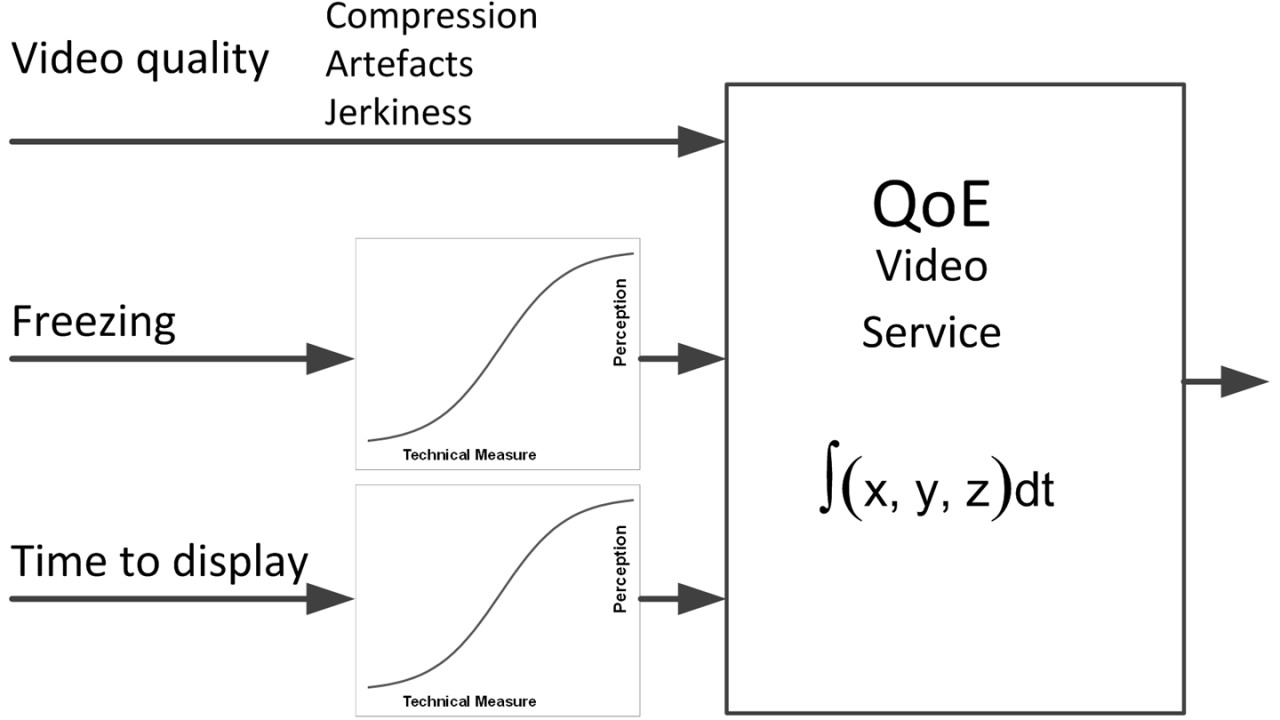
For mobile video services, end-user satisfaction is mainly determined by the
- waiting time (time to first picture)
- picture quality of the video stream
- video fluency (no freezing, sufficient frame-rate)


Each service’s applied streaming and buffering methods define how the air interface resources in mobile networks are used. All video services have in common that the video client (on the smartphone) starts to receive encoded video information from a content server, usually operated by a third-party company. The received video information is stored in a buffer to bridge irregular and short interruptions in reception.
To pre-buffer the video, individual video services apply different strategies: some buffer with high speed, while others throttle buffering to a cap; some start displaying after having buffered only a few seconds of video, while others buffer more before displaying. There is always an individually defined trade-off between network resources, waiting time, and the risk of upcoming freezing.
These key differentiators vary between stored videos (video-on-demand) and live video. In either case, after a certain amount of the video is buffered, the video display on the smartphone starts.
Transmission strategies of mobile video services
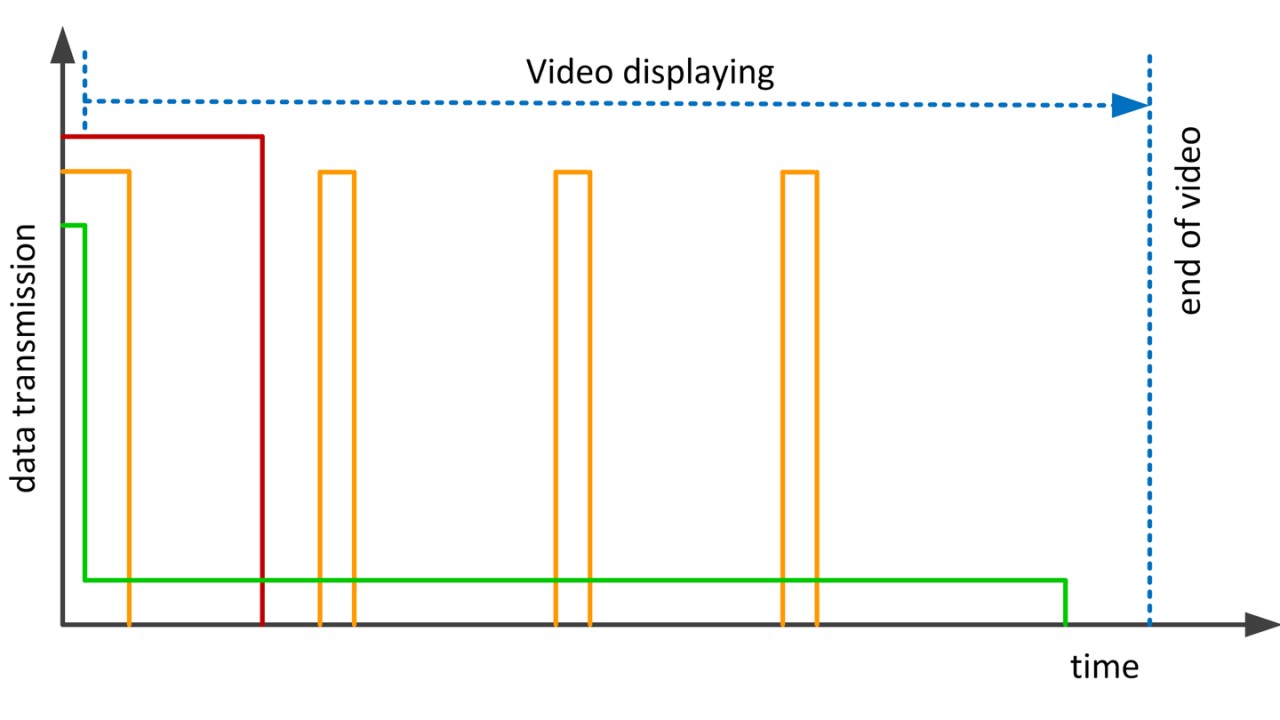
The image below illustrates the different strategies of how the remainder of the video file can be transmitted from the content server to the smartphone buffer via the mobile network. These range from a complete download before displaying anything to a progressive download (red line), where the display already starts while the download is still in progress, to a chunk-wise transmission and buffering of video sections (orange line) to near real-time streaming behavior (green line).


There are valid reasons for the different strategies to bypass potential interruptions. For example, compared to a continuous reception, a chunk-wise transmission saves power on the smartphone and uses air interface resources more efficiently.
In the end, it is always a trade-off between the amount of transmitted data, buffer size, and wasted resources on the one hand; and real-time requirements, the risk to run into a video freeze (due to, e.g., coverage issues), and the efficient usage of air interface resources on the other hand. The strategies are often fluently and adaptively adjusted by client-to-server communication and relate to the network, technology, and compression, meaning that the video quality can adapt to the channel’s capacity.
What is the key metric for video quality perceived by the end user?
Of course, a good start is to measure technical key features such as image resolution, frame rates, bitrate estimates, and freezing counts. In the end, however, they only contribute to the quality perceived by a user. Video compression is highly scalable; based on the algorithm and its settings, the same resolution and bitrate can result in different image quality. The content itself impacts quality since adaptive algorithms first analyze the video content and then apply the best settings. Freezing and lower frame rates are only measured values; their perception depends on the video’s motion, and compression makes use of this insensitivity.
Finally, an integrative measurement on a perceptual basis is the most reliable way to evaluate all effects, ranging from compression and resolution degradation to jerky video displaying and complete pausing. Those measurements are perceptual video quality measures, ideally based on direct image analysis predicting a visual MOS related to a real user quality perception.
Learn more about testing mobile video quality and video MOS on our dedicated web page.


