Written by Arnd Sibila | January 19, 2017


It may sound a bit trivial and might not really be considered a capacity enhancement feature, such as the previously discussed smart macro network enhancements carrier aggregation and 4×4 MIMO. Yet, antenna tilt optimization can have a significant impact on coverage and capacity. In fact, many cell antennas in today’s mobile networks are not properly aligned. This is because, over the last 25 years, the focus of mobile communication was on ensuring voice calls (handover functionality) and coverage.
What is the problem with antenna downtilting?
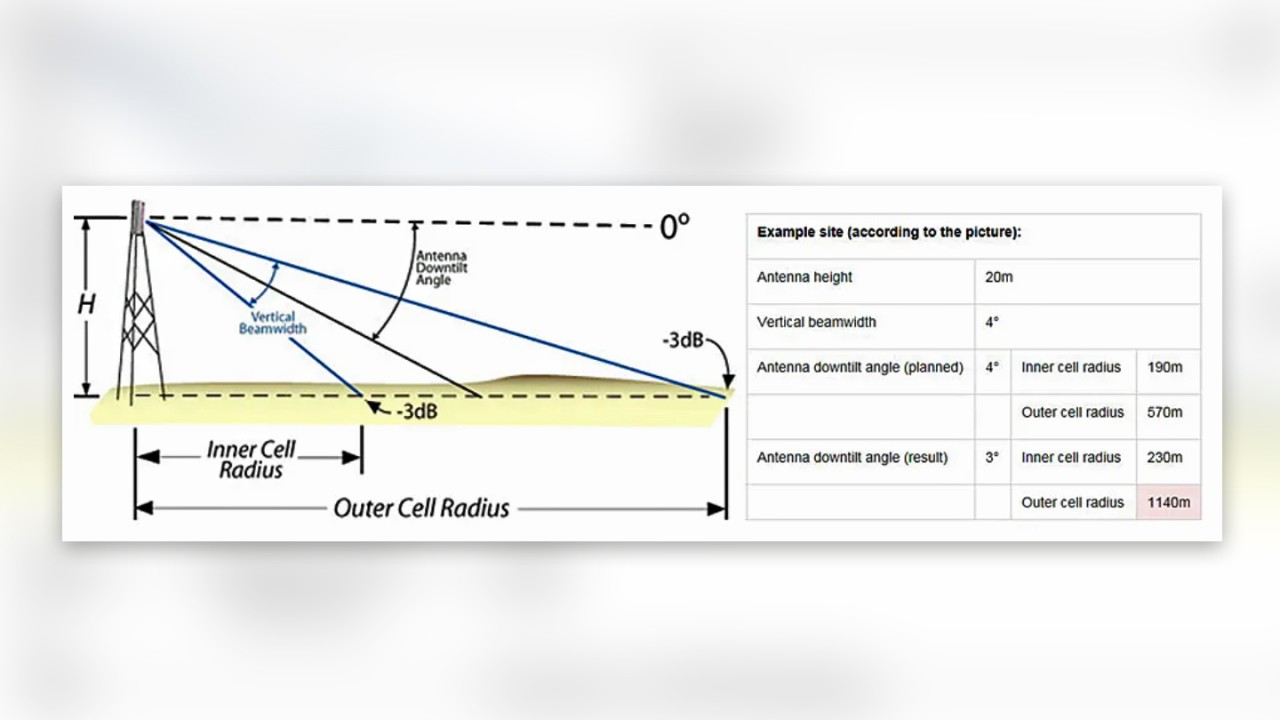
To understand the problem and the level of difficulty, we need to look at how directive antennas affect cell size. The example site and calculation below offer clarification:


The planned antenna downtilt is 4 degrees; the inner cell radius can be calculated to 190 meters and the outer cell radius to 570 meters. If the antenna were misaligned by only 1 degree (antenna downtilt angle of 3 degrees, which is 1 downtilt degree less), then the outer cell radius would be calculated to be 1140m. So, we would have doubled the outer cell radius, equaling 4 times the coverage area. This example shows the sensitivity of base station antenna tilts.
The consequences of such antenna downtilt misalignments include:
- Mobile coverage holes: with too much downtilt, we are likely to encounter coverage holes, since we lack overlapping areas of neighboring cells, necessary for handovers. Dropped calls and other inferior KPIs make it easy to quickly detect such severe consequences of misaligned antennas.
- Interference issues: with too little downtilt, as in the example above, the base station radiates too far, creating interference with neighbor cells. Interference always results in worse data rates and worse capacity. These soft impacts are harder to detect.
Antenna tilt optimization should ensure that inter-cell handovers work properly, and network interference is minimized. This results in improved KPIs and optimized capacity.
What is the measurement technology behind antenna tilt optimization?
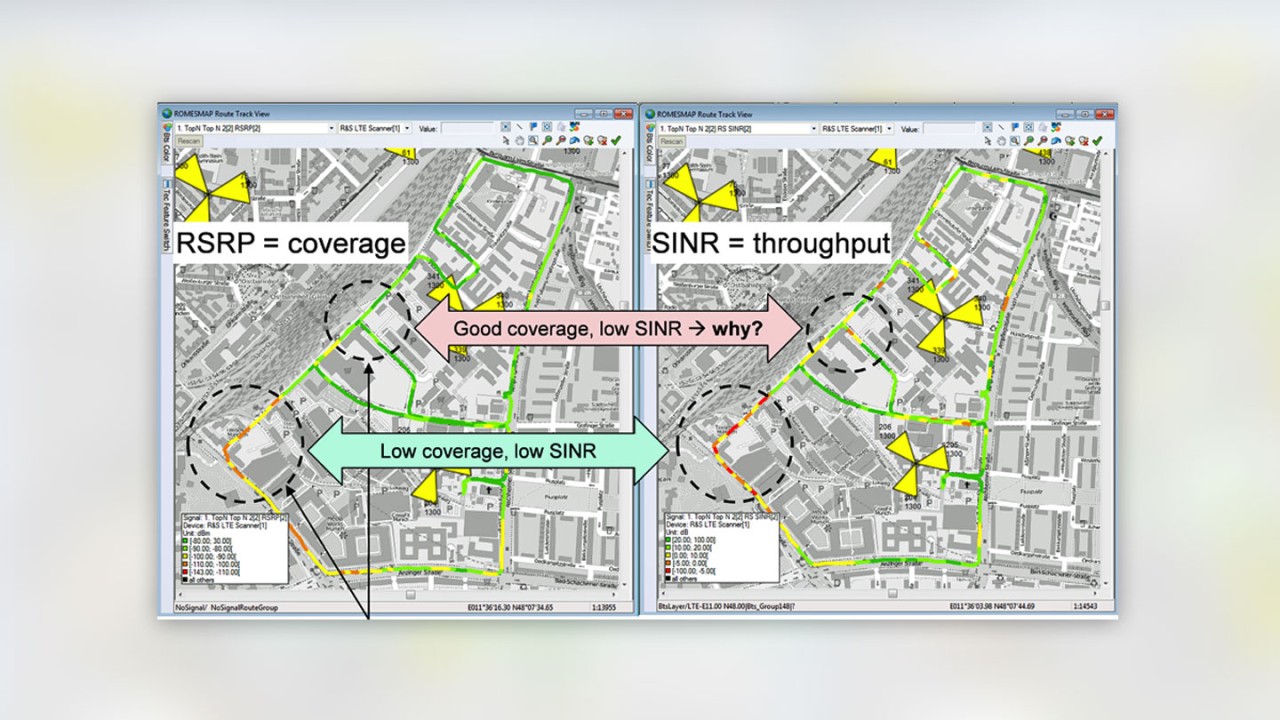
The 2 most important parameters to focus on are coverage and data throughput. The measure for coverage in LTE is the RSRP (Reference Signal Received Power), an indicator of the power that a user receives from a base station. A suitable measure for data throughput is the SINR (Signal to Interference plus Noise Ratio). The higher the SINR for a user, the more data can be transmitted with a given number of air interface resources.


In the image above, the larger black circle in the lower-left corner of each image shows an area with a bad RSRP (yellow and red color), which means bad coverage and a low SINR, translating into a low throughput. This is a typical scenario: in areas with bad coverage, you normally get low data rates.
The smaller black circle on the left shows an area with good coverage (green color); in the circle in the image on the right, however, the yellow and red color indicate a low SINR and low data rates. Low data rates in an area with good coverage, how can that be? The assumption is that overlapping areas of neighbor cells are too big, causing what is known as pilot pollution.
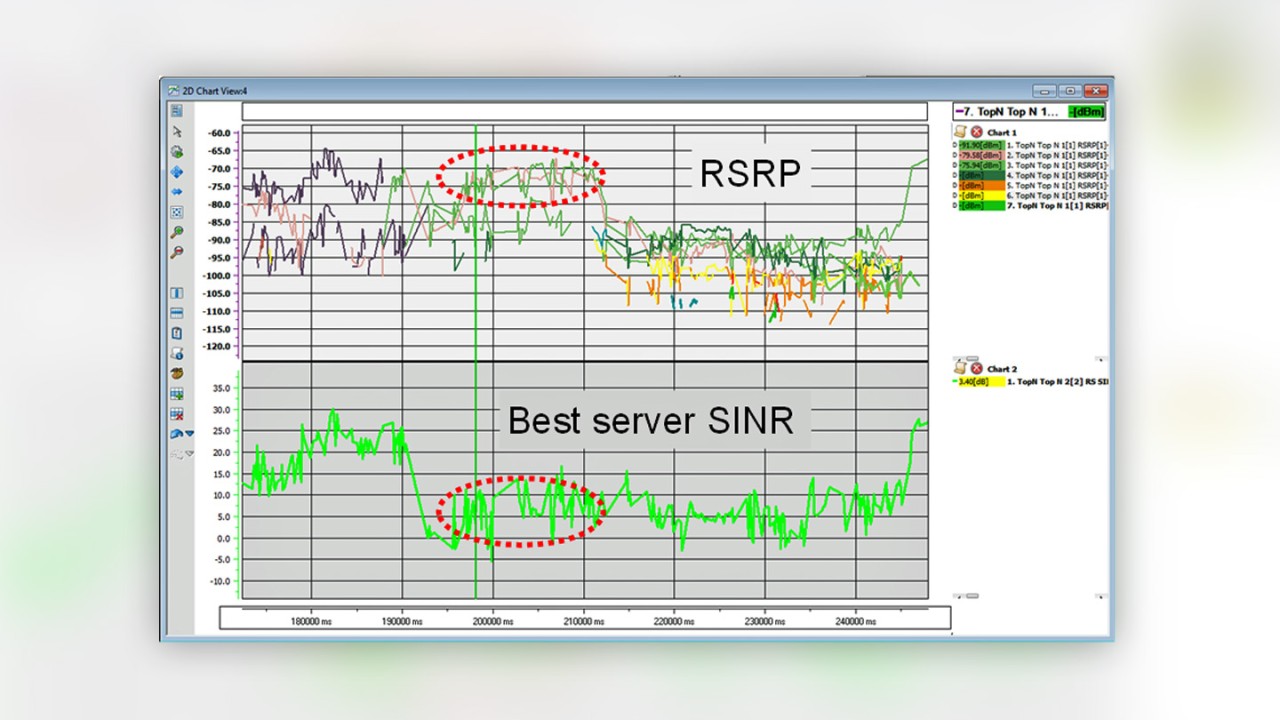
A more in-depth analysis (troubleshooting) shows that 2 base stations in this critical area could be received with a similar receive power (similar RSRP) – see the screenshot below. Consequently, the SINR with the best-received base station has to be low, since 1 strong interferer is present. This is proof of pilot pollution.


What is the test solution for antenna tilt optimization?
With our mobile network testing products, the root cause of problems such as too wide-spread coverage or pilot pollution can be easily identified. Scanners work passively or non-intrusively (they just listen to the air interface) and offer a superior RF performance. Also, scanners can help validate network planning simulations, which are getting increasingly more complex.
Learn more about R&S®ROMES4 and Rohde & Schwarz mobile network testing scanners and products.


