Effortless testing of direction finding devices – amplitude based

With the R&S®Pulse Sequencer radar simulation software, users can easily and intuitively create scenarios for simulation of angle of arrival (AoA). Together with multiple coupled R&S®SMW200A vector signal generators, this solution allows quick and thorough performance characterization of all types of direction finding equipment such as devices that use amplitude comparison, interferometric or time difference of arrival (TDOA) techniques. This document describes our test solution for testing devices that use amplitude comparison techniques.

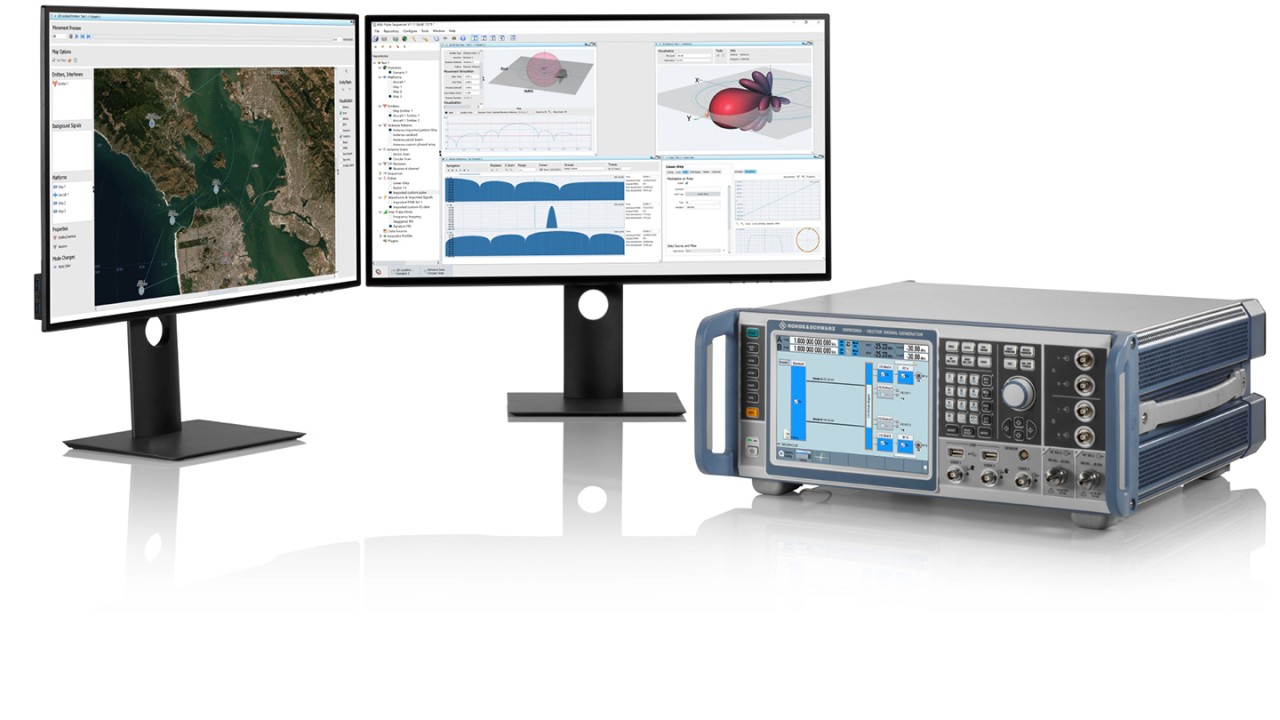
Fig. 1: Generate complex radar scenarios. With the R&S®Pulse Sequencer radar simulation software and the R&S®SMW200A vector signal generator
Open Lightbox

Your task

A radar warning receiver (RWR) is an essential part of the self-defense suite of every modern military aircraft. The primary task of a radar warning receiver is to detect radar signals, identify the emitter and determine the angle of arrival (AoA) of the radar signal. A commonly used technique for determining the AoA is amplitude monopulse. It uses multiple antennas mounted around the aircraft to achieve 360° azimuth coverage.

Developing and testing of RWRs would be difficult without a simulator that can generate all the test signals needed throughout the development cycle of the receiver.

The simulator needs to be flexible enough to provide everything from simple radar pulses for early hardware validation to complex, multi-emitter scenarios for testing at the system level. Ideally, the simulator hardware comes as a commercial off-the-shelf (COTS) solution, eliminating the need to design expensive and inflexible customized hardware. Additionally, the definition of signals and creation of complex scenarios has to be easy and straightforward, avoiding the time-consuming task of writing extra simulation software.

Rohde & Schwarz solution

Rohde & Schwarz offers a powerful package for simulating the angle of arrival. This package consists of the R&S®Pulse Sequencer radar simulation software and multiple coupled single or dual-path R&S®SMW200A vector signal generators.

The R&S®SMW200A vector signal generator can provide two RF paths of up to 20 GHz, or one RF path up to 44 GHz. In order to achieve timing synchronization across all RF paths, internal clock signals and triggers are shared between the generators.

If dedicated phase differences between the RF ports are needed, for instance to test direction finding devices that use interferometric techniques, it is possible to distribute the internal local oscillator (LO) signal from the master instrument to the slave instrument or use an external LO, e.g. coming from the R&S®SMA100B analog signal generator.

The R&S®SMW200A vector signal generator allows playback of a nearly unlimited variety of signals. From simple unmodulated radar pulses to radar signals with complex modulation schemes and modulation on pulse (MOP), the R&S®SMW200A can generate a realistic and dense RF environment. The high modulation bandwidth of 2 GHz provides the R&S®SMW200A with excellent frequency agility, enabling the simulation of modern radars.

With the R&S®Pulse Sequencer software, users can easily create radar scenarios as well as control and configure multiple R&S®SMW200A. The R&S®Pulse Sequencer software covers a wide range of testing applications, from simple pulse sequences to highly sophisticated scenarios with multiple complex moving emitters. Users can create custom waveforms and configure emitters in detail.

The flexible user interface simplifies the creation of realistic test scenarios. Easy handling of the software speeds up test case generation and provides more time to test. The calculated scenario is then loaded directly onto the R&S®SMW200A. The format of the calculated data can be pulse descriptor words (PDW) or I/Q waveform files. Speed optimized calculation routines minimize waiting time during scenario calculation and allow flexible and iterative test case design.

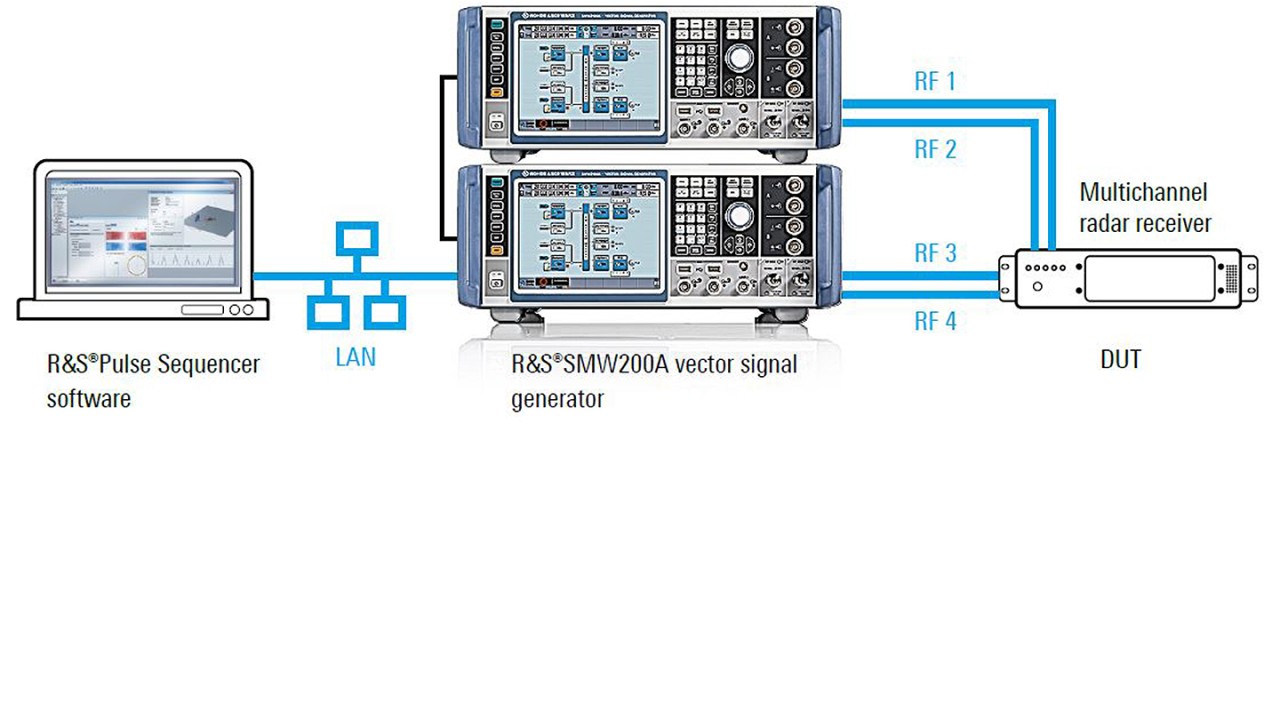
Fig. 2: Simulation of angle of arrival (AoA) with a four-channel test setup. This setup is good for simulating angle of arrival (AoA) of emitters with two coupled dual-path R&S®SMW200A vector signal generators. The R&S®Pulse Sequencer software automatically calculates the relative delay, relative phase or relative amplitude values between the individual RF ports.
Open Lightbox

Testing a four-channel RWR

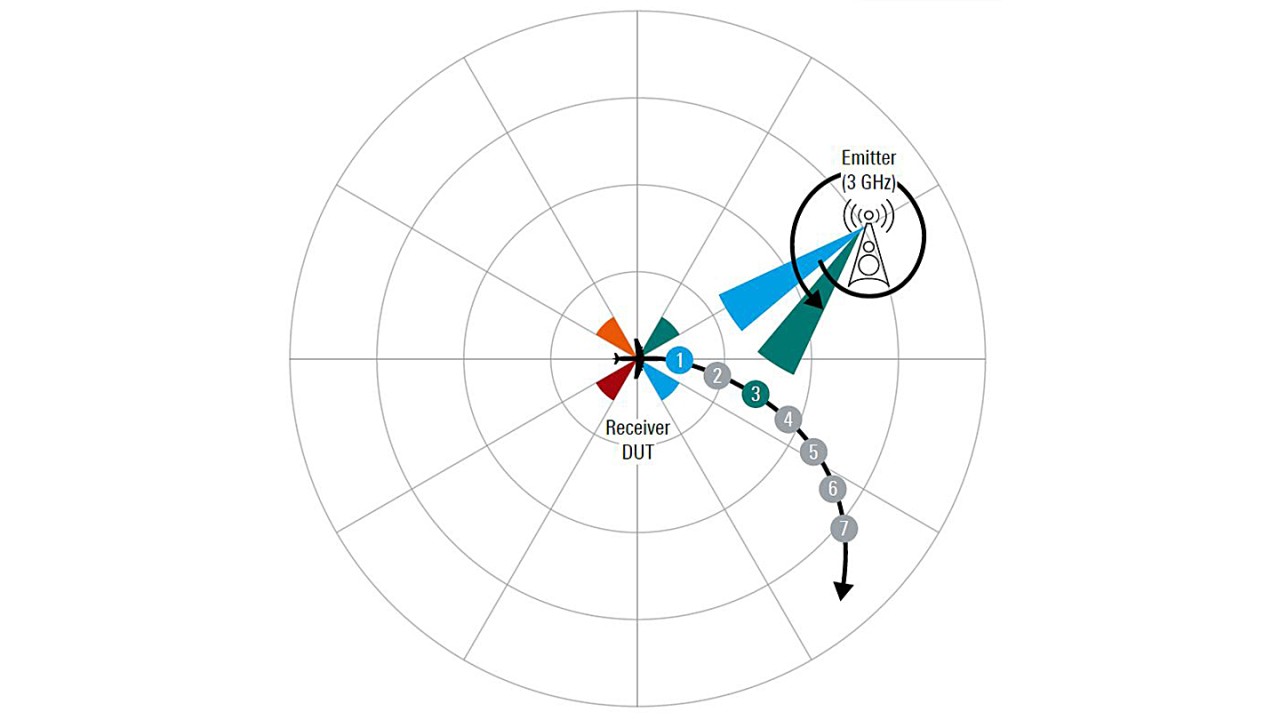
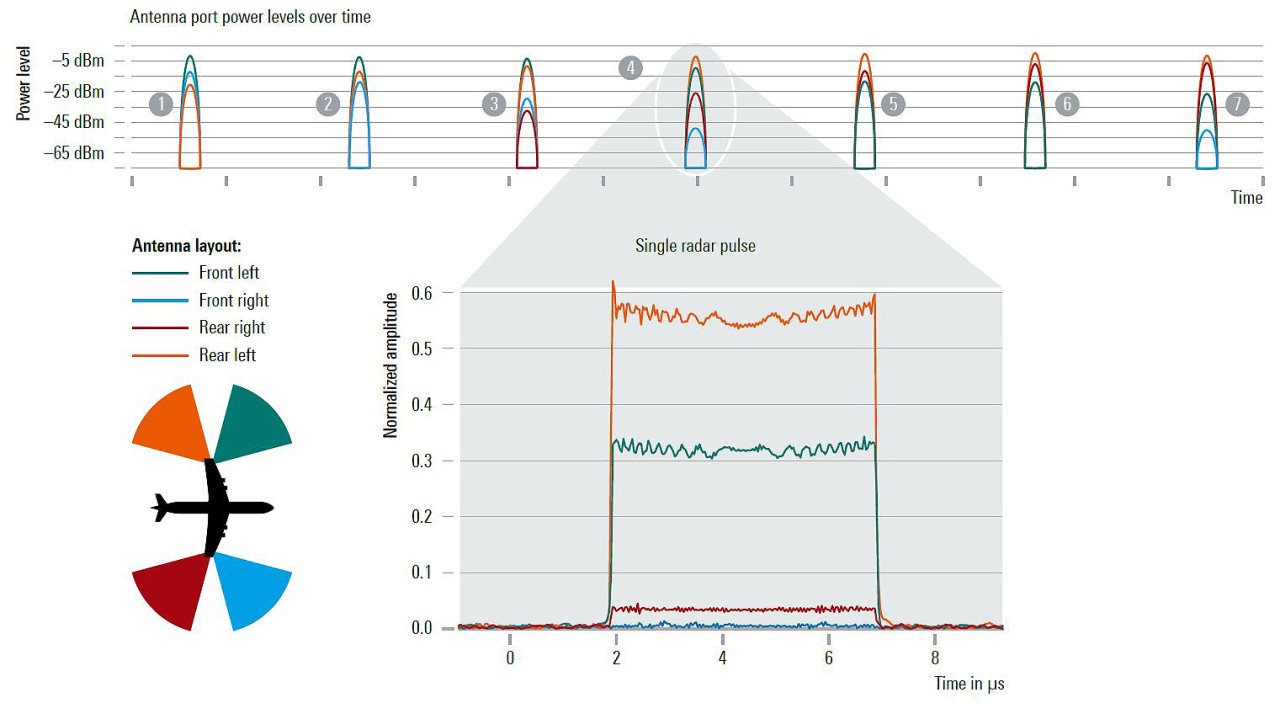
A test setup for a four-channel RWR consists of two dual-path R&S®SMW200A to generate the simulated radar signals (Fig. 2). One is configured as the master instrument, the other is configured as the slave, allowing fully synchronized playback of the radar pulses. Fig. 3 shows an example scenario created by the R&S®Pulse Sequencer software. The aircraft flies along a circular track. To the left of the aircraft a ground based, static radar with a circular antenna scan is positioned at an initial relative bearing of 330°. The aircraft is carrying four directional antennas at its wingtips, each pointing in a different direction, as illustrated in the antenna layout in Fig. 4.

Fig. 3: Example scenario for RWR testing. Scenario map showing the trajectory of the aircraft and the positions at which the radar scan hits the aircraft.
Open Lightbox

The receiver signals simulated for each antenna are mapped to one of the four RF paths. Every RF path is then connected to the corresponding RF input of the RWR.

As the aircraft moves along its trajectory, it is hit by the radar scan several times at positions 1 to 7. At each position, different power levels are recorded at the four antennas due to the changing AoA of the emitter signal. The power level at each antenna port can be seen in the graph in Fig. 4, with the numbers corresponding to positions 1 to 7 on the scenario map.

To obtain the bearing to the emitter, the monopulse principle is used. When a radar pulse is detected, the two highest power levels at adjacent antennas are compared. If the emitter is situated exactly in the center between both antennas, the received power levels will be equal. When the emitter is offset from the center, one antenna will receive a higher power level. The ratio of the received power levels is used to obtain the exact bearing to the emitter.

Fig. 4: Illustration of received signals at the four RWR input ports. Detected radar pulses at each antenna port over time. Antennas are mounted on the aircraft wingtips as illustrated.
Open Lightbox

Simulated pulse power levels over time

In the lower part of Fig. 4, a single radar pulse as recorded by the four RWR inputs at position 4 is shown. At this position, the front and rear left antennas receive the highest power levels since they are facing in the direction of the radar. Calculating the monopulse ratio between the orange and the green signal gives the emitter bearing of approximately 250°.

Mapping of the result into the pilot’s display

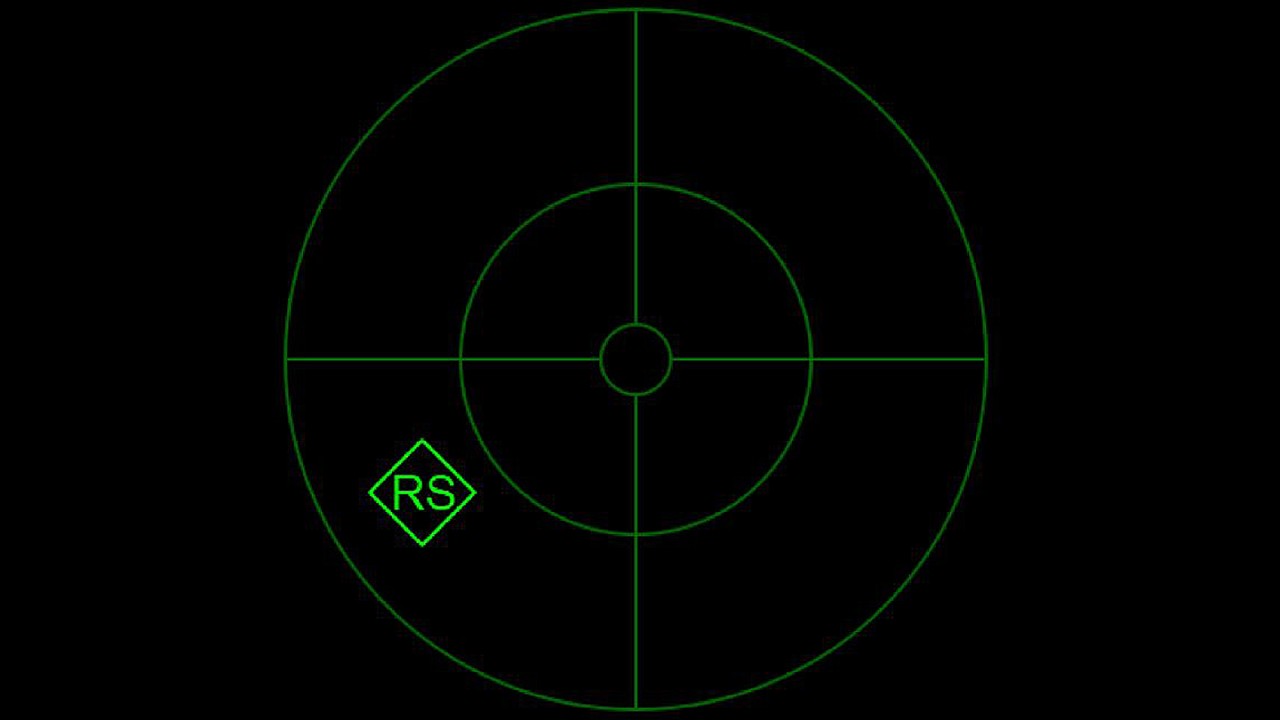
During operation of an aircraft, the identified emitters are presented to the pilot in the cockpit. The bearing of the emitter is calculated by the computer and displayed to the pilot on the RWR display. The figure below shows how the emitter in the described scenario is presented to the RWR operator or the pilot when the aircraft is at position 4. The test is considered successful if the bearing determined by the RWR corresponds to the simulated bearing.

Benefits

  • Scalable and compact multichannel signal generator setup
  • Quick and flexible scenario generation with multiple emitters/interferers
  • High signal accuracy with 2 GHz modulation bandwidth
  • Simulation of six degrees-of-freedom (DoF) movements
Fig. 5: RWR indication in aircraft at position 4. RWR threat display showing the detected emitter at the 8 o’clock position for the aircraft. The number indicates the type of emitter while the diamond marks it as the primary threat.

Related solutions