Measuring switching patterns
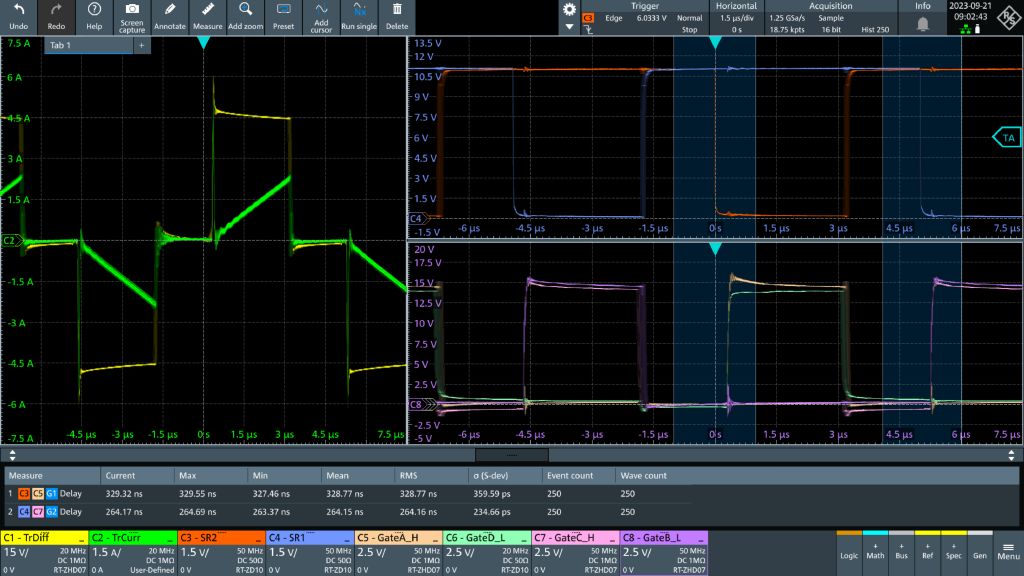
After setup, switch on the DC power supply to start the measurement. As soon as the trigger detects a valid condition (falling edge trigger), the waveforms will appear (see Fig. 2). The left window shows the transformer (primary side) voltage and current (CH1, CH2). The synchronous rectifier states (CH3, CH4) on the secondary side appear in the top right window. All primary switching states (CH5 to CH8 ) are found in the bottom right window. In general, the switching pattern theory illustrated in Fig. 1 matches the measured waveform in Fig. 2 and the switching pattern has passed the test.
In addition to validating patterns, other parameters should be checked in more detail. The synchronous switch must be turned off before switching on the primary leg. Measuring minimum dead times helps prevent catastrophic shorts in the system. Two gate function definitions let delay measurements be defined for validating the minimum dead time between all relevant switches. Dead time results were measured automatically and included statistics and yields: TSR1 = 264 ns for the SR1 synchronous switch and TSR2 = 328 ns for the SR2 synchronous switch.
Further automatic measurement functions for rise times, fall times and other parameters are available but were not activated in Fig. 2. Automated measurements help validate all these parameters along with the general switching pattern for converter operation conditions. The measurements vary the converter input voltage and the output current.


