The smarter way to test BLE transmit signals
Smartly verify and decode Bluetooth® Low Energy (BLE) transmit signals with a reliable and costefficient spectrum analyzer – the R&S®FPC.

Smartly verify and decode Bluetooth® Low Energy (BLE) transmit signals with a reliable and costefficient spectrum analyzer – the R&S®FPC.


Bluetooth® 4.0 packets
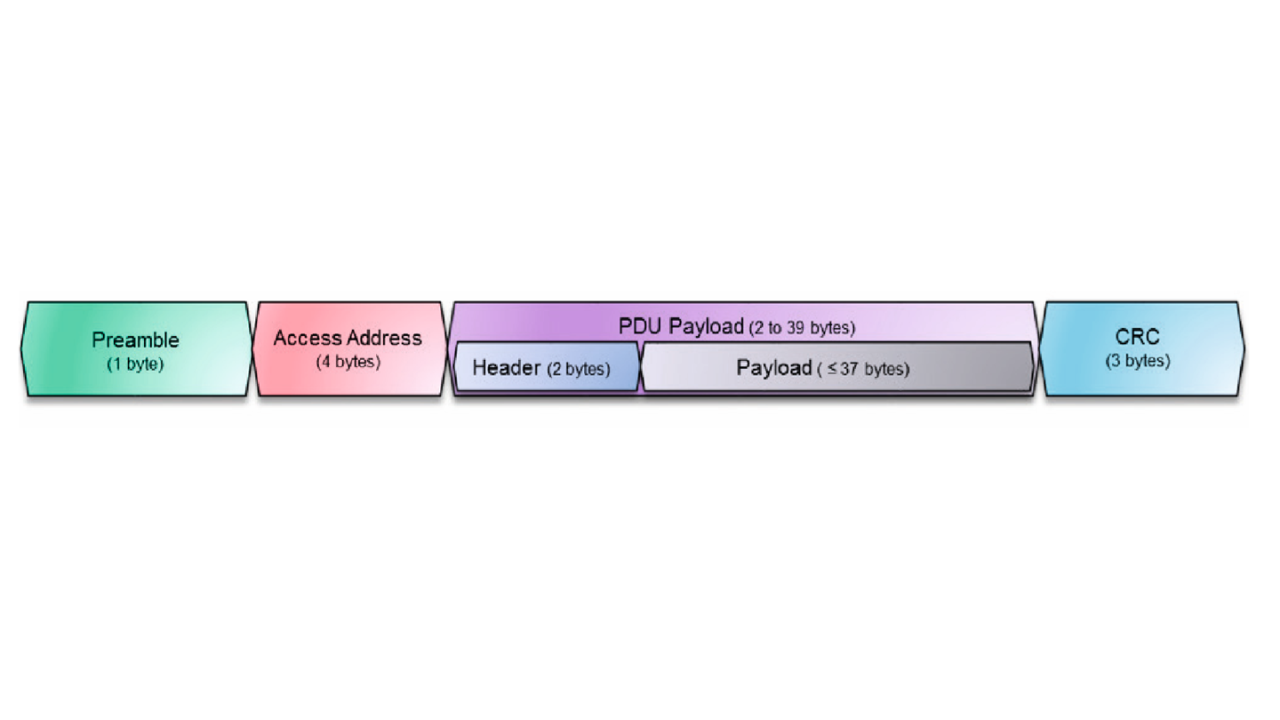
BLE uses 40 channels, with 3 dedicated channels (37, 38 and 39) for advertising packets and 37 channels (1 to 36) for data packets. The link layer packet structure consists of 4 mandatory fields: preamble, access address, PDU payload, cyclic redundancy check (CRC).
During and after the design stage of a BLE transmitter, it is important to conduct tests to ensure that the transmitted information is correct. Tests such as verifying the test packet structure, output power, modulation characteristics and carrier frequency error are necessary.
A BLE product is typically inexpensive, which makes it essential that the analyzer also fits in the pricing ecosystem. The R&S®FPC has excellent RF performance compared to its peers, the best price value and the flexibility to extend the frequency range. This makes it the right choice for testing BLE transmitters.
| Key specifications | |
|---|---|
| Frequency range | 5 kHz to 1 GHz, with upgrades up to 3 GHz |
| Max. input power | up to +30 dBm |
| Low noise floor | down to typ. –165 dBm (with preamplifier) |
| Connectivity | LAN, USB, Wi-Fi (optional) |
| Measurement options | modulation analysis, receiver mode, advanced measurements |
| Tracking generator | 5 kHz to 1/2/3 GHz |


Before performing any test on a BLE DUT, connect an antenna or the DUT to the R&S®FPC RF input port and configure the test setup using the values in the table below.
| R&S®FPC setup configuration | |
|---|---|
| PRESET | |
| Mode | Digital Demodulation |
| Frequency | 2402 MHz |
| Ampt | Reference Level ▷ –20 dBm |
| Sweep | Trigger ▷ I/Q Power ▷ –30 dBm |
| Meas | FSK ▷ Standard ▷ Bluetooth® LE |
| Ampt |
Deviation per ▷ 100 kHz Division |
| Meas | Demod Parameters ▷ Burst Processing |
| Number of Symbols ▷ 400 |


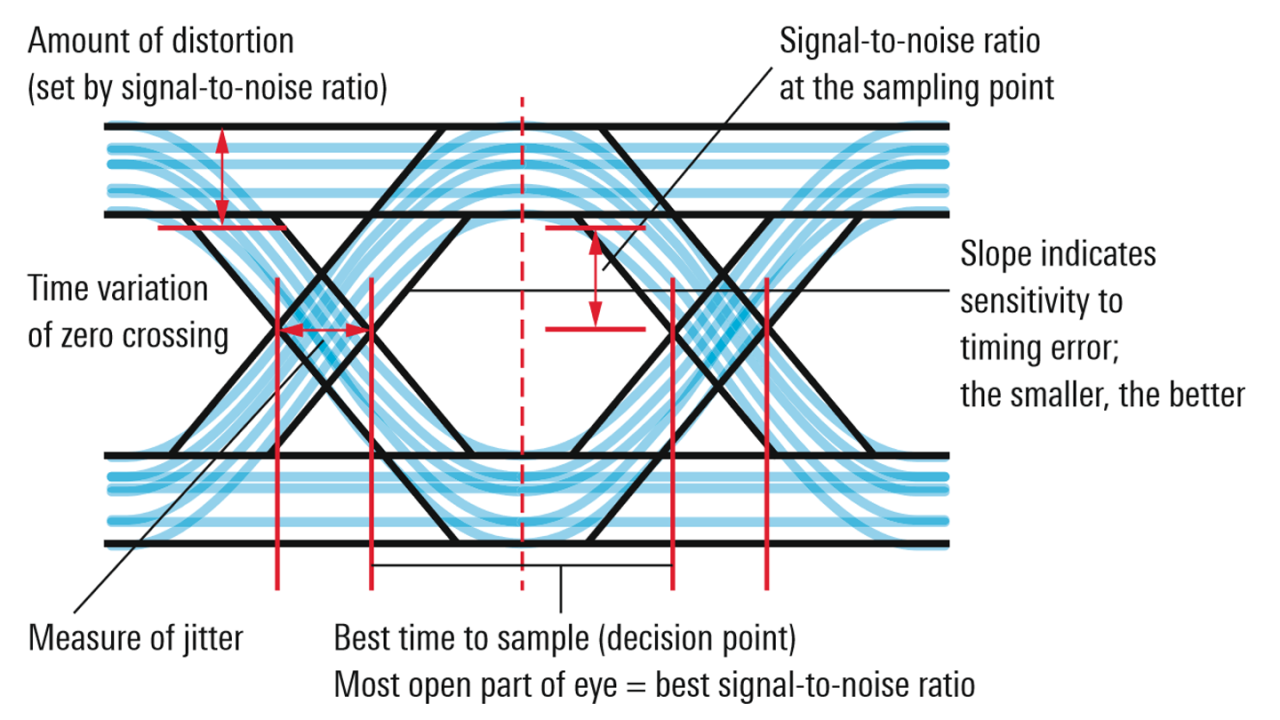
Interpretation of eye diagram (source: http://www.testandmeasurementtips. com/basics-eye-diagrams).
Verifying the data structure
The data structure for different packets can be identified in the symbol display. The BLE beacon advertisements channel in Fig. 1 shows 8 bit for the preamble, 32 bit for the access address and 16 bit for the header. The last 24 bit are for the CRC. Between the header and the CRC is the payload. The transmitted symbols should comply with the design.
Modulated signal
The modulation deviation mode displays a BLE modulated signal in the spectrum view. The carrier frequency deviation, carrier power, carrier frequency drift and modulation error are shown above the signals. Check these values to ensure the results are within the design specification.
Evaluating the quality of the BLE signal
The eye diagram provides a quick visual inspection of the signal integrity. It helps you easily identify design issues.
The BLE transmit signal can easily be evaluated using an R&S®FPC with the R&S®FPC-K7 modulation analysis option. R&S®FPC-K7 also supports AM, FM, ASK and FSK modulation analysis.
The Bluetooth® word mark and logos are registered trademarks owned by Bluetooth SIG, Inc. and any use of such marks by Rohde & Schwarz is under license.