Application Notes

Time sidelobe measurements optimize radar system performance

The R&S®FSW signal and spectrum analyzer measures and analyzes time sidelobes to optimize compressed radar signals as well as radar hardware components and systems. Developers of radar systems can improve and immediately validate their design using automated and reproducible measurements.

Efficient pulse compression measurements with the FSW signal and spectrum analyzer
Efficient pulse compression measurements with the R&S®FSW signal and spectrum analyzer
Open Lightbox

Your task

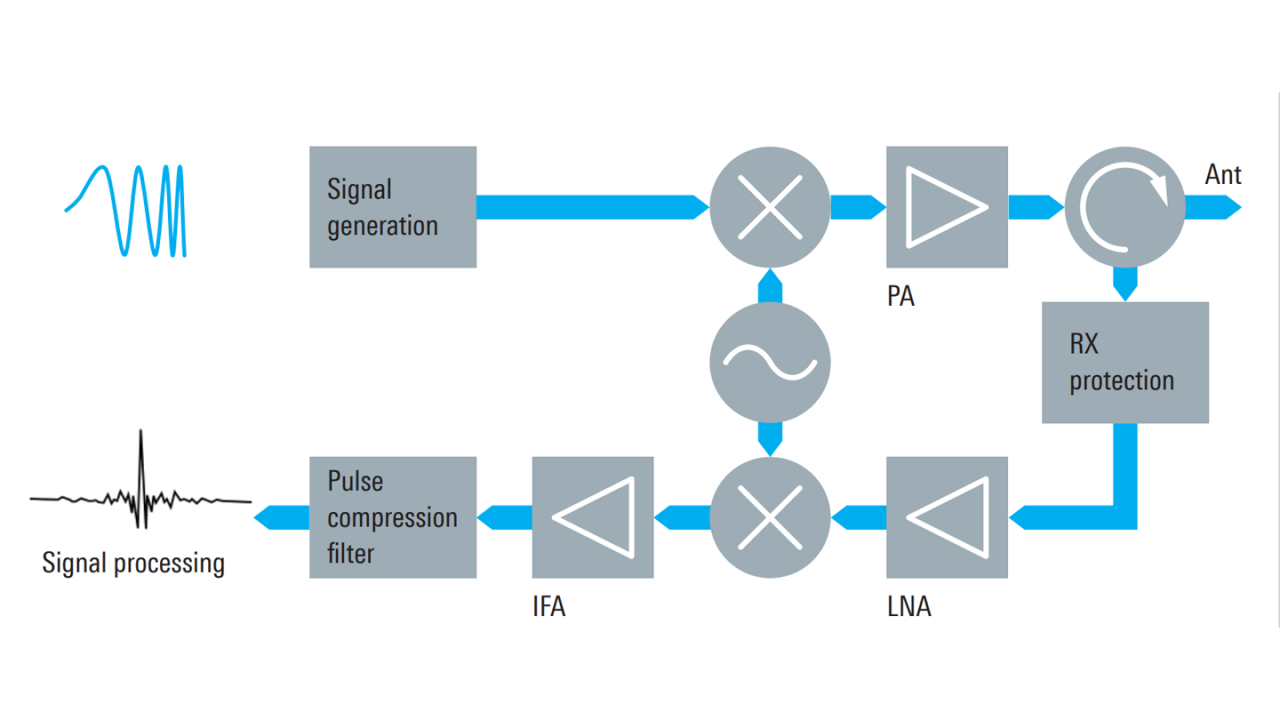
Pulse compression is often used in radar applications to combine the advantages of excellent range resolution and high energy with a low peak power output. This is achieved by designing radar waveforms with a time-bandwidth product much greater than one, which is typically the case with pulsed frequency or phase modulated signals. A corresponding matched filter in the radar’s receive channel automatically compresses the radar echo signal in time and increases the peak value by the approximate pulse compression ratio. The output of the pulse compression filter is a narrow pulse with a large peak value in the time domain.

Radar system using digital pulse compression filter
Open Lightbox

Unfortunately, this technique increases the radar’s blind range because of longer pulse transmission times, and it affects the Doppler measurement due to a reduced SNR in cases where a compression filter has mismatch (ambiguity function). In addition, range-Doppler coupling may occur, where the Doppler shift of the echo signal affects the range measurement accuracy. The autocorrelation function of the expanded pulse consists not only of the main peak, but also contains time sidelobes at the matched filter output that may mask smaller echo signals or cause false alarms. Pulse compression performance is influenced by the radar waveform as well as the system design and components. Therefore, a controllable, repeatable and time-saving test environment is the key for achieving top-level radar performance. This is especially true for multifunction radars aimed at superior probability of detection, high accuracy, and resolution both in the range and the Doppler domain.

Rohde & Schwarz solution

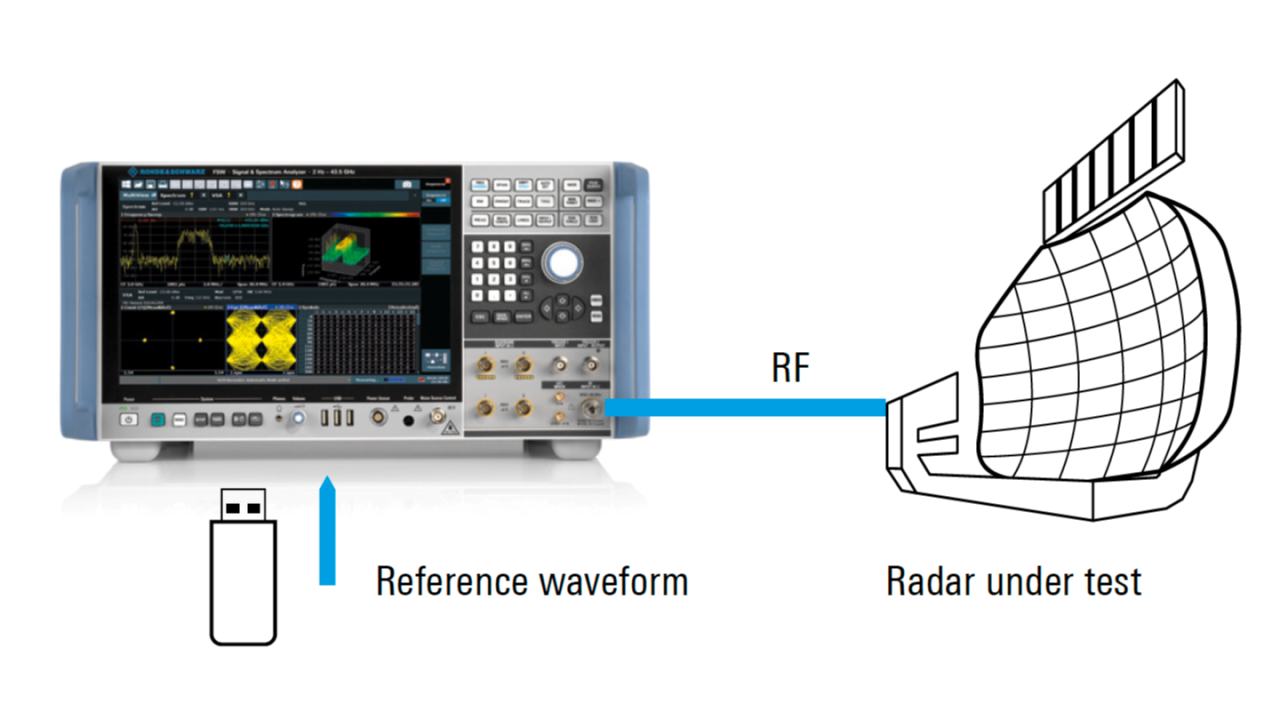
The R&S®FSW signal and spectrum analyzer equipped with the R&S®FSW-K6 pulse measurement and R&S®FSW K6S time sidelobe measurement options effectively analyzes pulse parameters and additionally pulse compression. This solution allows radar design engineers to verify and optimize their radar signals, signal processing and components using automated, reproducible measurements. In addition, signal disturbances such as intentional echo signal distortion can also be verified in a straightforward manner. For the test setup, the radar transmitter is connected to the RF input of the R&S®FSW. An ideal waveform in digital I/Q (iq-tar) format is loaded into the analyzer, which operates as a pulse compression filter. The ideal waveform can be synthetically generated or previously recorded with the R&S®FSW.

The actual measured radar pulse waveform is cross-correlated with the ideal I/Q waveform. In the case of an ideal measured pulse, the two waveforms will be identical, exhibiting the same narrow mainlobe curve. In practice, however, the waveforms will differ, e.g. due to I/Q modulator inaccuracies, phase noise and VSWR between stages. The more the waveforms differ, the less effective is the compression ratio, and time sidelobes may increase, causing radar system performance to degrade.

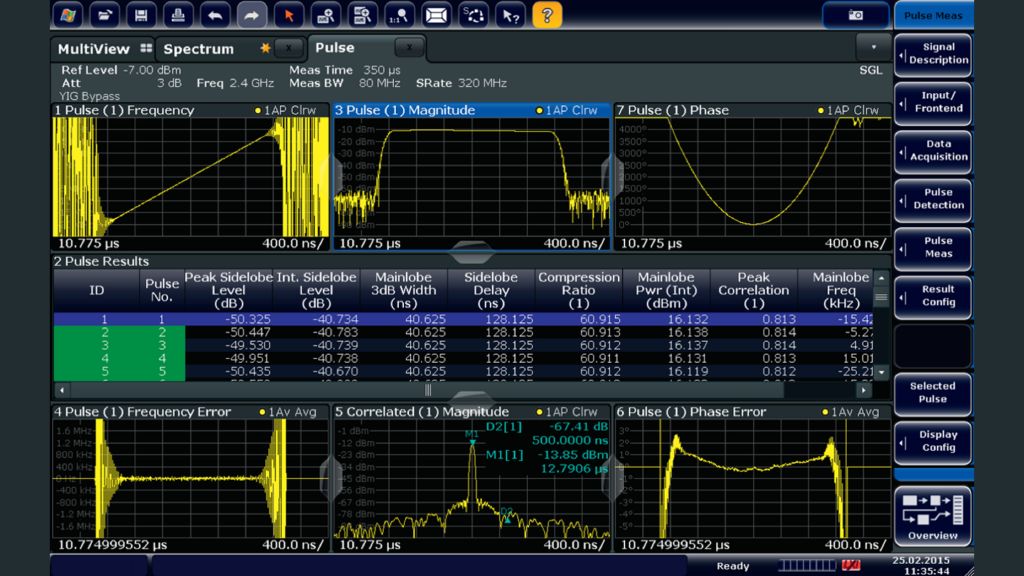
The differences between measured and ideal waveforms result in sidelobes in addition to the mainlobe. The crosscorrelation function is clearly visualized by the correlated magnitude graph displayed on the R&S®FSW, allowing efficient evaluation.

The main pulse parameters, including mainlobe width, sidelobe suppression, sidelobe delay, main and sidelobe integrated power, peak correlation and mainlobe frequency and phase, are also automatically measured and displayed.

The R&S®FSW with pulse and time sidelobe measurement options allows radar system designers and engineers to efficiently optimize, verify and test their pulse compression radar waveforms, components and the entire system to achieve superior radar performance.

R&S®FSW
The R&S®FSW displays the correlated magnitude, frequency and phase error traces as well as pulse compression parameters for a linear frequency modulated waveform
Open Lightbox

Key features

  • Frequency range from 2 Hz to 90 GHz; up to 500 GHz with external mixers
  • Wide analysis bandwidth up to 8.3 GHz
  • Low phase noise of –140 dBc (1 Hz) at 10 kHz offset (1 GHz carrier)

Key benefits

  • Can be used to analyze your own proprietary waveforms
  • Easy configuration and fast measurement results
  • Automated detection, measurement and analysis of pulses and pulse compression