Verification of wideband power amplifiers

The required bandwidth span for power amplifiers is growing, driven by the latest 5G and satellite enhancements.
Ideally, amplifiers support multiple bands. This makes wideband testing more essential than ever before.

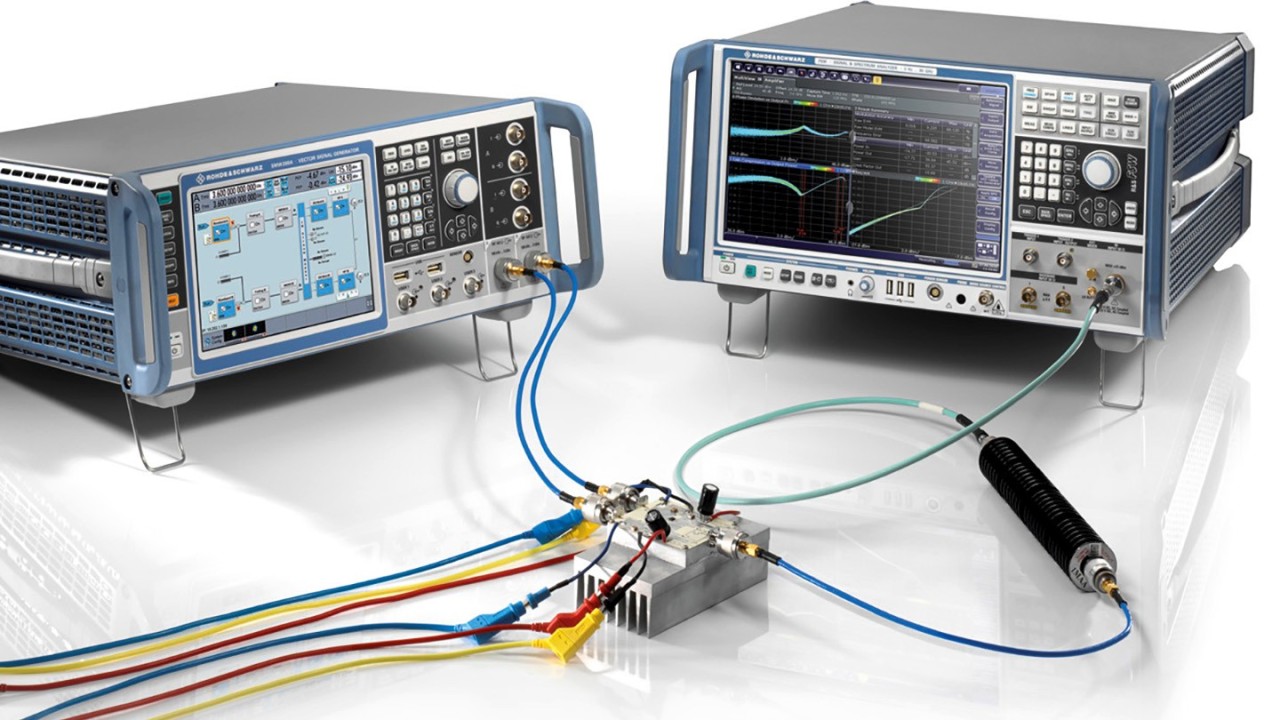
The dream team for verifying wideband power amplifiers- SMW200A and FSW
The dream team for verifying wideband power amplifiers: R&S®SMW200A and R&S®FSW

Your task

Developing a wideband power amplifier is a multidimensional task. You have to meet the typical performance criteria such as linearity in the given frequency bands and requested power levels while optimizing efficiency. EVM, AM/AM and AM/PM distortion are critical parameters for wideband signals. In some cases, an internal or external customer provides the test signal without explanation, making demodulation a challenge. In order to get the best efficiency, the operating point of the amplifier is close to its compression.
This makes its performance highly nonlinear. Digital predistortion (DPD) helps linearize the performance at the system level. An easy-to-use DPD tool is needed during amplifier verification.

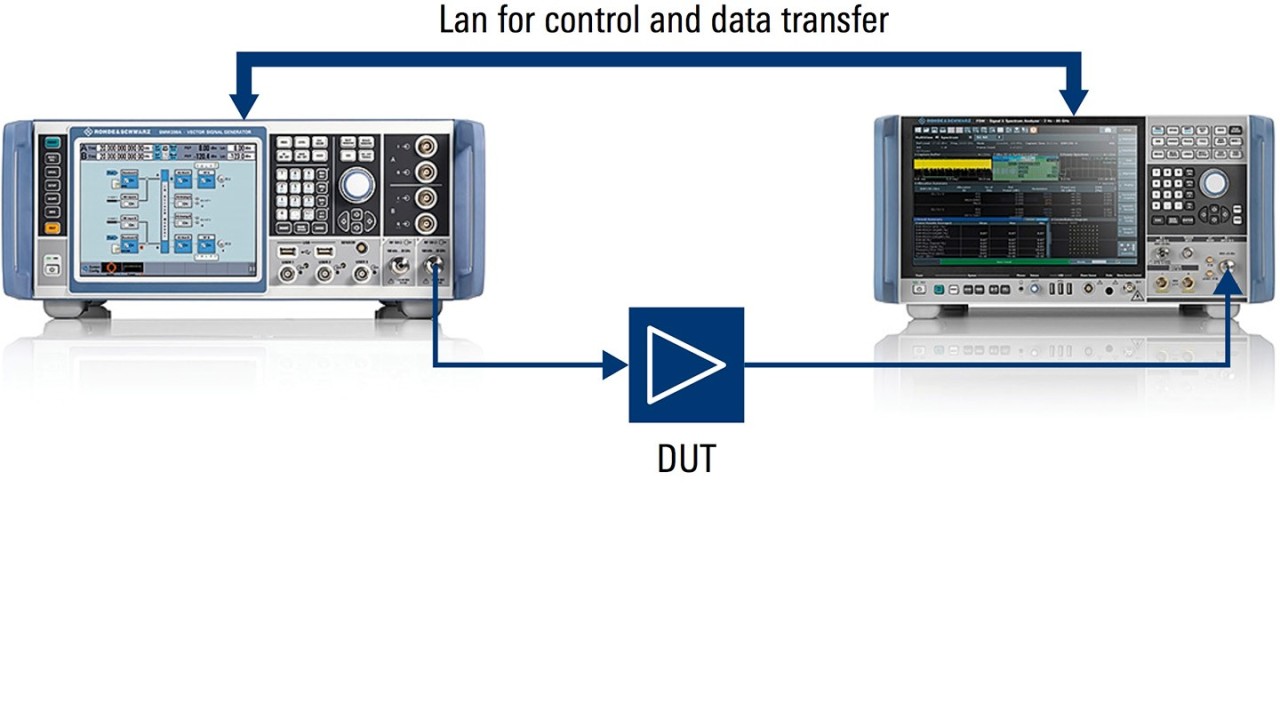
Test setup
Test setup
Open Lightbox

Rohde & Schwarz solution

Rohde & Schwarz has developed a closed loop solution for wideband amplifier testing using the R&S®SMW200A vector signal generator and the R&S®FSW spectrum and signal analyzer. This combination setup supports RF bandwidths up to 2 GHz and RF frequencies up to 44 GHz.

The R&S®FSW-K18 amplifier measurements option is a dedicated test application that controls the signal generator and offers user-friendly and automatically synchronized setup.
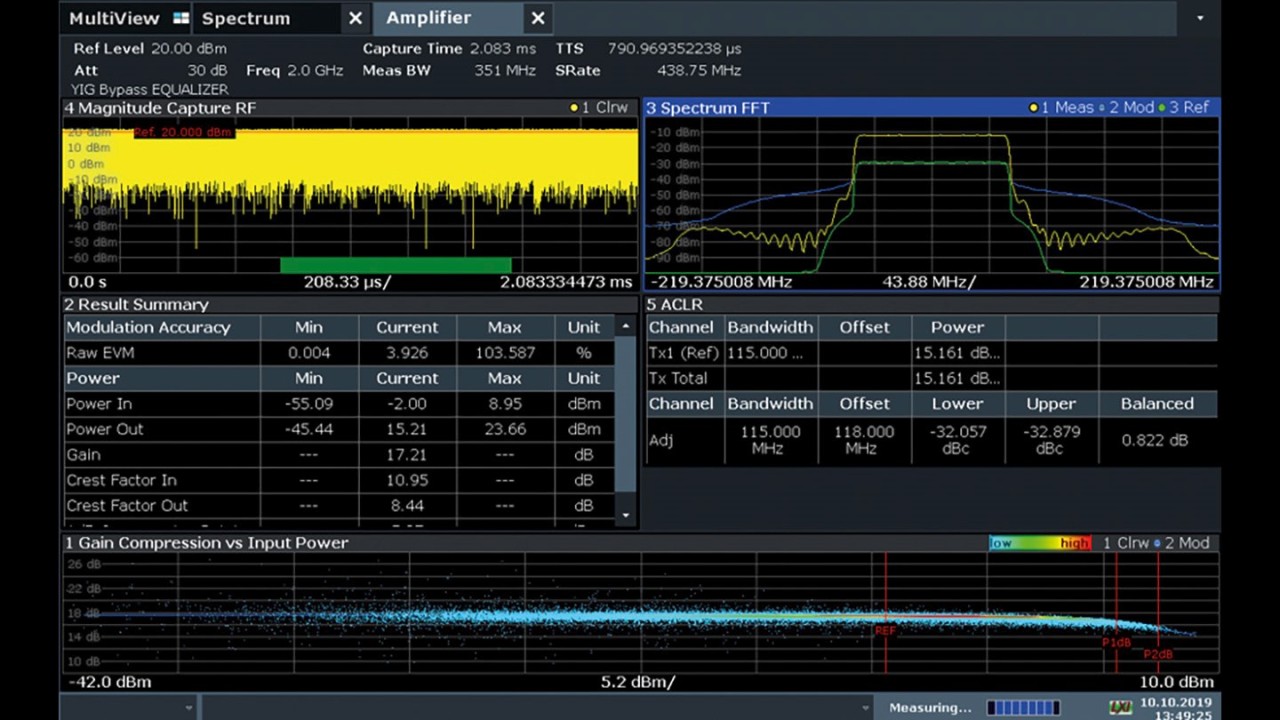
The R&S®FSW-K18 option offers all key features needed for amplifier characterization. It provides insight into the sources of signal degradation due to nonlinearity, frequency response and signal-to-noise ratio. Many characteristics such as EVM, ACLR, AM/AM and AM/PM, gain and gain compression are derived from one RF measurement.

The R&S®FSW-K18 option’s unique approach allows any test waveform to be used to derive EVM, regardless of the standard – and even if the user does not know the signal type or structure, which might be the case if an end customer provides the wanted test waveform. Here is the secret: R&S®FSW-K18 compares the received signal with the reference signal sent by the vector signal generator.

Most amplifiers typically operate close to their compression in a very nonlinear mode to improve efficiency. The unique R&S®FSW-K18 EVM method delivers more accurate EVM results than standard demodulation techniques.

In 5G, the peak-to-average ratios are very high due to the signal structure. Crest factor reduction is typically used in installations to improve the efficiency of the amplifiers. The R&S®SMW-K548 option on the vector signal generator allows the signal to be manipulated to show a desired crest factor, and it applies additional signal filtering.

R&S®FSW-K18 amplifier measurement application
Open Lightbox

The R&S®FSW-K18 option, together with the R&S®FSW-K18D direct DPD measurements option, offers two digital predistortions:

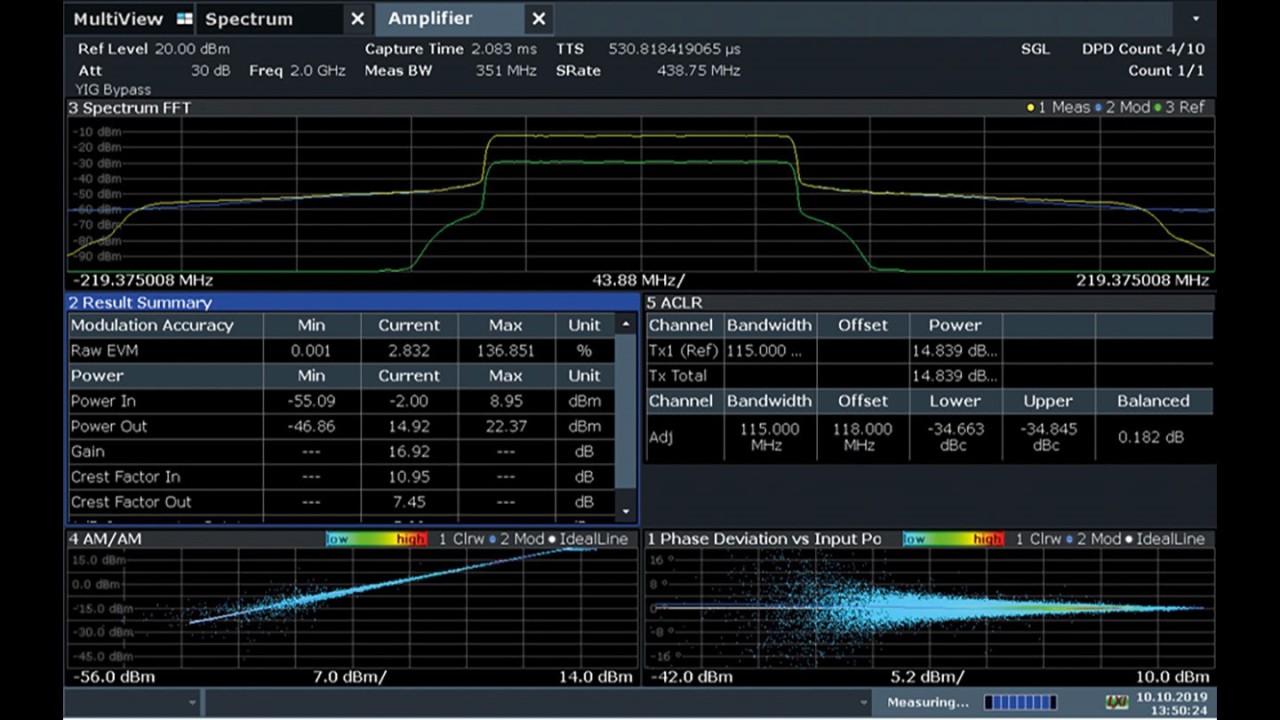
  • The R&S®FSW-K18 comes with a polynomial based model that optimizes the AM/AM and AM/PM behavior of the amplifier. To speed up test routines, the signal generator applies the DPD model directly to the signal in real time without any waveform recalculation. This works well for mobile amplifiers or integrated frontends.
  • The R&S®FSW-K18D option as an add-on performs direct DPD to assess the linearizability of the devices. It includes memory effects as well as other nonlinearities. This is very important for infrastructure and satellite applications, especially with the latest GaN technologies. Direct DPD is not based on a polynomial. It performs direct digital predistortion and iteratively compensates for the frequency response and the spectral performance. A MATLAB® toolkit to derive a model from the R&S®FSW-K18D results is available in a free application note.
Results with direct DPD
Open Lightbox

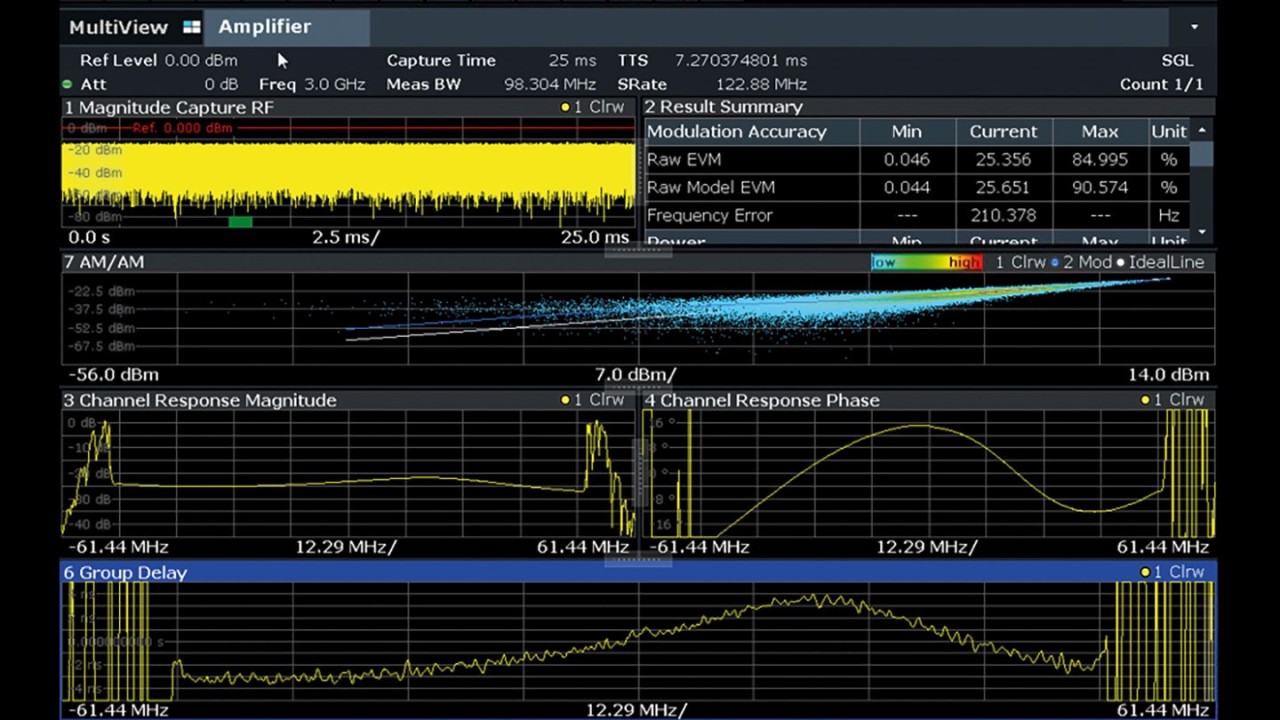
The R&S®FSW-K18F option examines the details of memory effects and provides insights into the frequency response and group delay of a device. The frequency response shows the channel response in magnitude and phase versus the reference signal. The group delay gives information about the time delay across the used bandwidth.

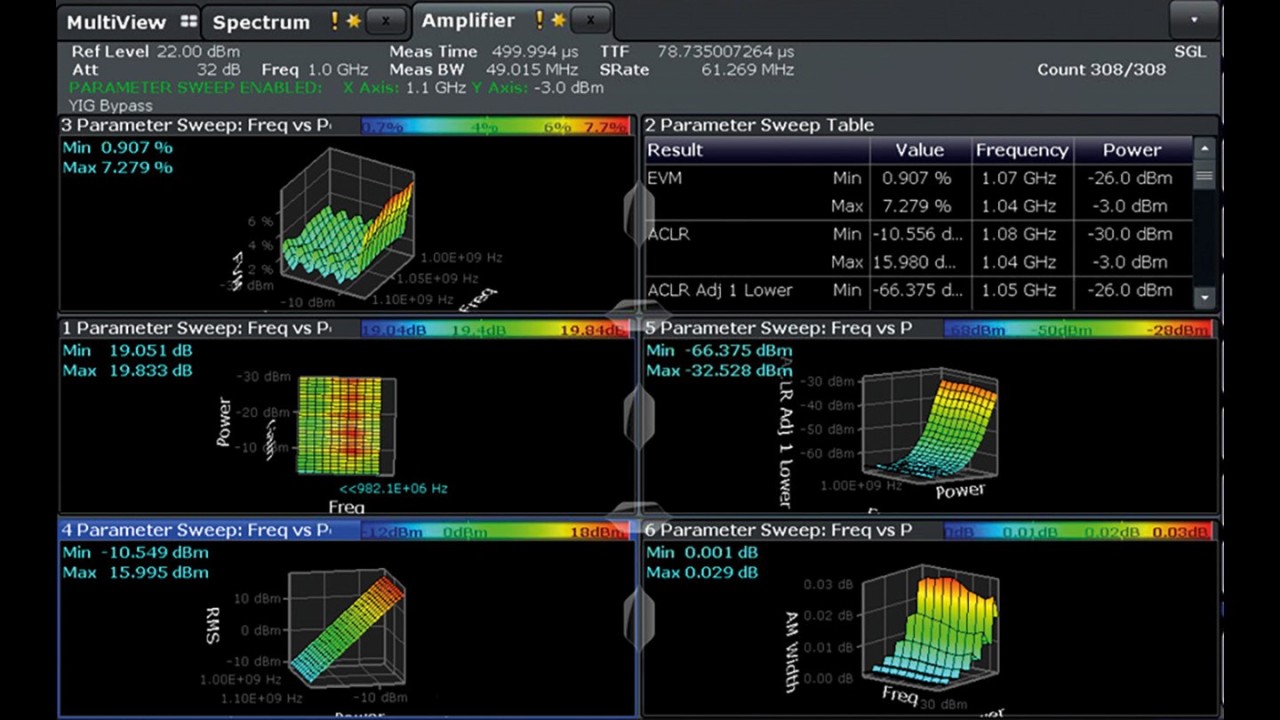
To simplify characterization over frequency and power range, the R&S®FSW-K18 offers an automated parameter sweep. It controls the signal generator sweeping across a user-defined sweep range and performs the desired measurements at each sweep point. The results are presented in 3D graphics and offer a fast overview of the acquired data. All results are of course available for detailed investigation and remote extraction.

Frequency response and group delay measurements
Open Lightbox

Summary

The amplifier measurement application from Rohde & Schwarz offers an easy-to-use toolset that supports all important measurements to characterize wideband amplifiers. It gives insight into nonlinearities, provides improvements with integrated DPD solutions, and works with any test signal to deliver EVM performance results.

Display of automatic parameter sweep results

Related solutions